When it comes to making software better, you need a combination of insights and action: Insights to tell you where users are struggling and what’s causing problems, and actions to guide users to a better experience.
Userpilot positions itself as a solution for small teams just getting started that need quick-fix in-app guidance and basic usage metrics. But even in this limited context, the platform fails to give the kinds of insights necessary to address the most common use cases product leaders face. Here are ten questions tied to these use cases you can easily answer in Pendo—but not Userpilot.
Understanding user behavior and journeys to increase adoption and revenue
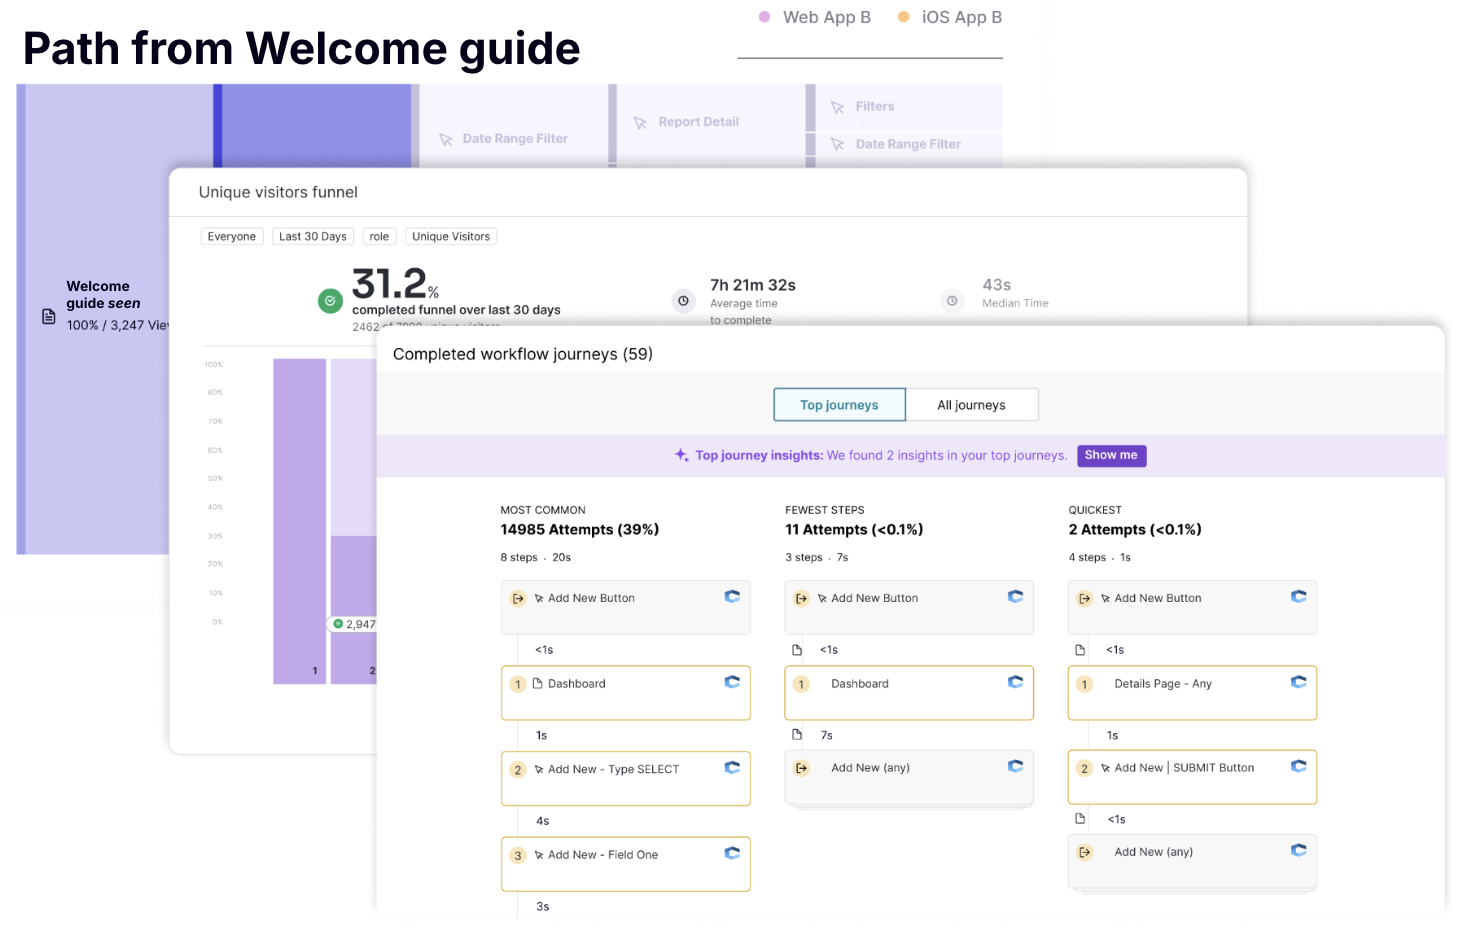
1. Where do users go after viewing my guide?
Being able to understand where users navigate to in your product after viewing a guide validates how effective the guide is at driving desired behavior. Unfortunately, mapping user behavior from Userpilot guides in path reports isn’t possible without investing in specialized dev work.
With Pendo, teams can see where users go post-viewing a guide instantly. In addition to mapping their entire journey leading up to the guide. This out-of-the-box functionality is even included as a readymade dashboard template or singular widget.
Pendo についてもっと詳しく知りたいですか?
2. How does my multi-step onboarding guide change behaviors across the funnel?
It’s critical to be able to see how each step of your onboarding guides help users get acquainted with your product or achieve their tasks. And yet, to see guide steps in a Userpilot funnel, teams have to manually tag each individual step across all of their guides, and label them with distinct names that they hope people will recognize. Pendo does. Teams can make each step of a guide they’re deploying (for onboarding or any other purpose) a funnel step, and can see whether users saw or dismissed a guide at each.
3. What’s the optimal user journey through a workflow? How long does it take? Is it what most users are doing?
For product teams, being able to identify the optimal journey through a workflow is essential for optimizing the user experience and their time to value. This is especially true when designing an onboarding process that leads users to a key activation event or “aha” moment.
Userpilot does not come with designated workflow or journey reports, and there’s no way to track the time it takes different users to complete a specific workflow without manual analysis. With Pendo workflow journeys, this information is at your fingertips.
Knowing what to prioritize to minimize churn, cut costs, and reduce risk
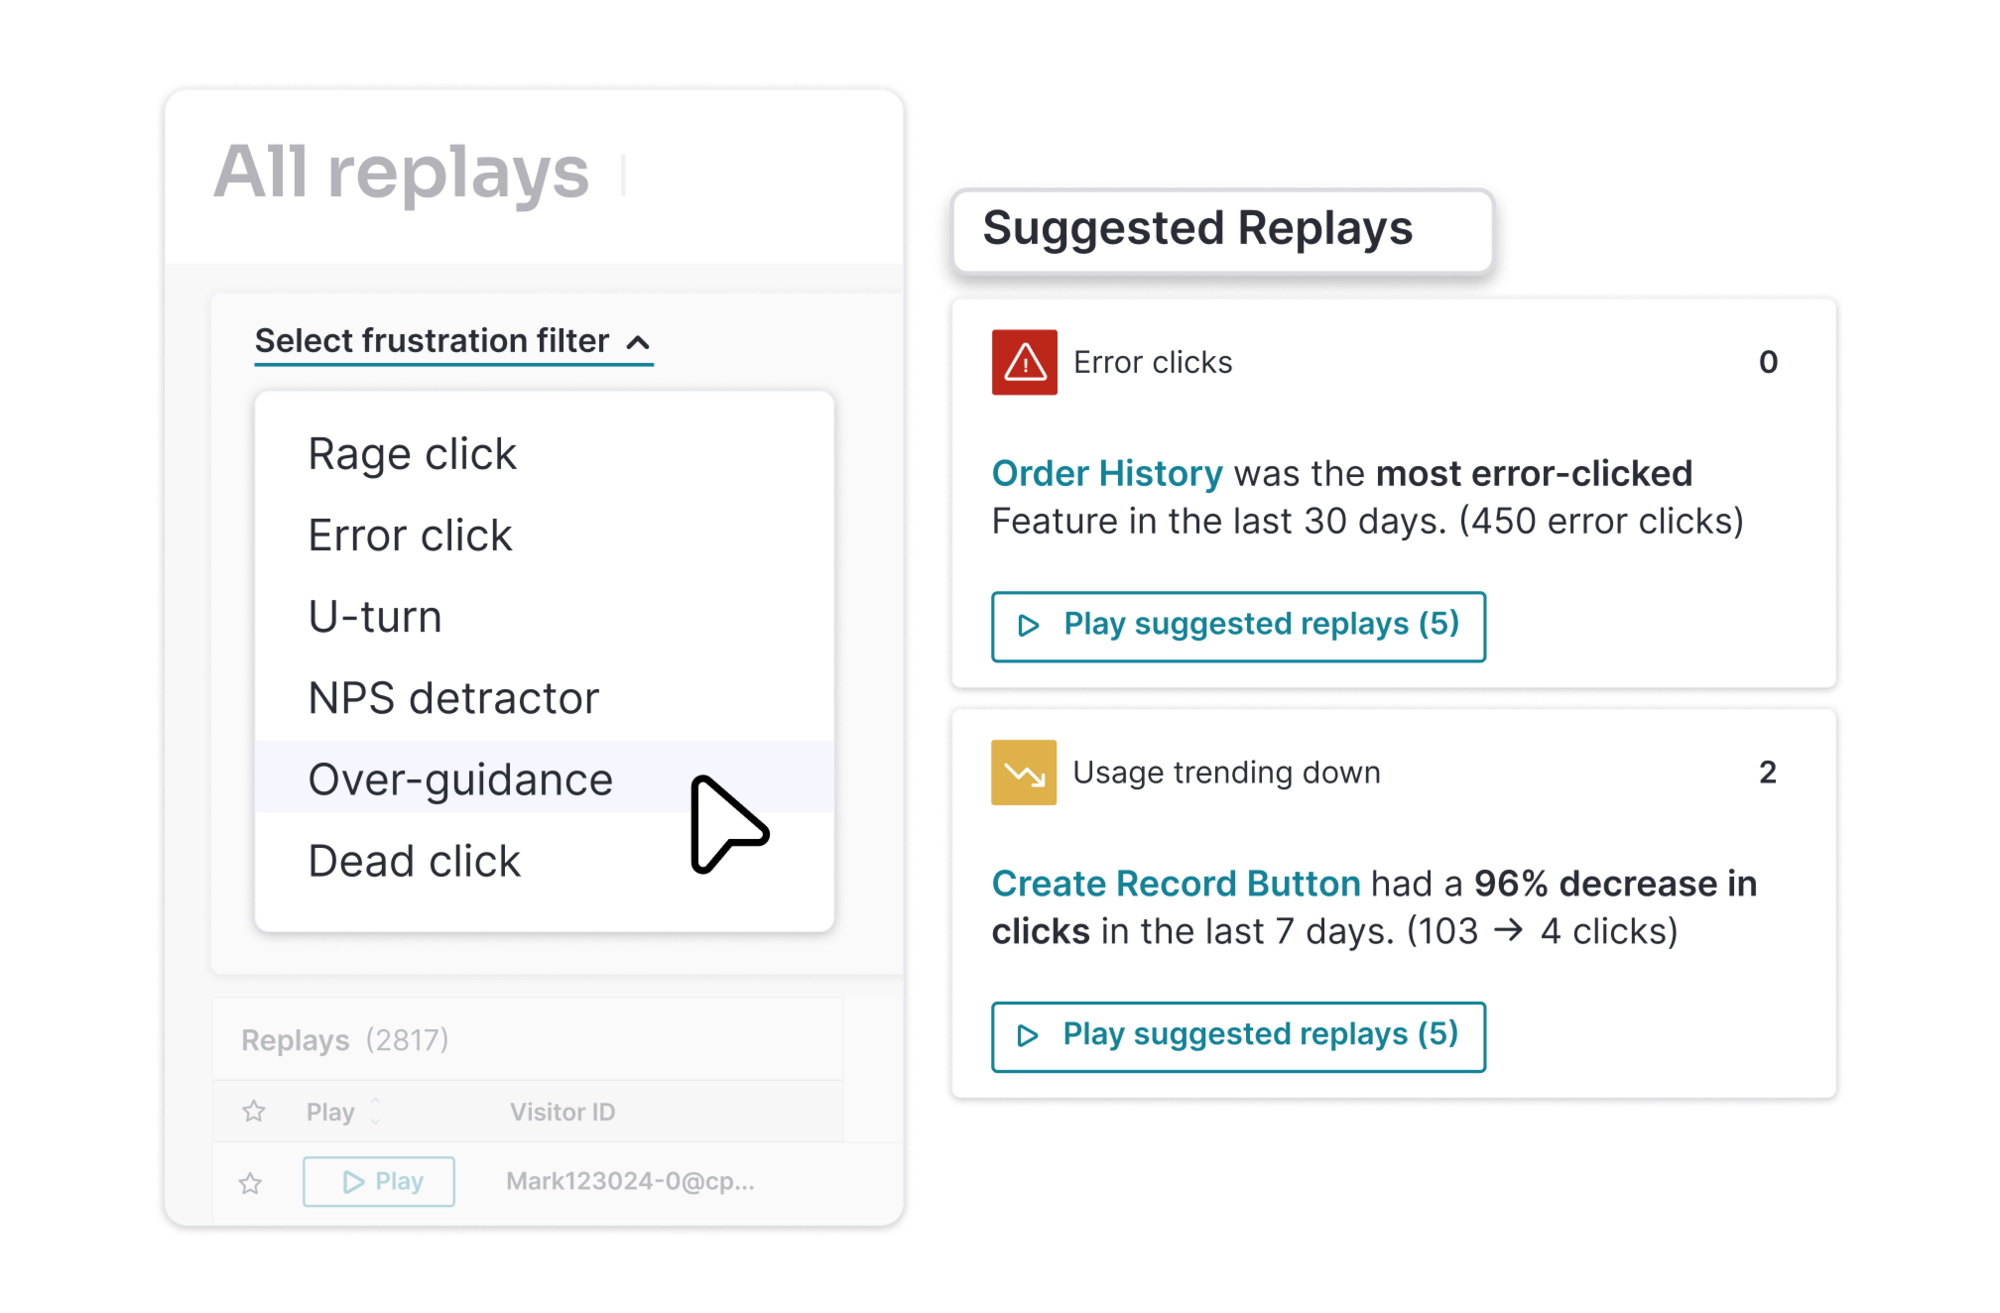
4. Where are users most frustrated right now and where should I focus improvements?
No product is perfect, and at any given moment there will be a laundry list of fixes and upgrades to make. But how do you know where to start? Generally, the answer is: where your users are experiencing the most pain.
With Userpilot, there’s no way to assess behavior across your product by different types of user frustrations and pinpoint the biggest issues. If you want to spot where users are experiencing the most error clicks (often signaling unknown bugs), for example, Userpilot can’t provide an answer automatically. You’d have to manually sift through static user data or disjointed feedback to find any friction points. With Pendo, Suggested Replays and frustration trends are surfaced right to you. This allows teams to prioritize issues based on data-backed user pains, often ones they may not have known existed.
5. Are there any major friction points, like slow page-loads or unreported bugs I don’t know about?
The actions you take to improve a product are only as effective as the insights you’re basing them on. Without these signals, there’s no way to be proactive about addressing user issues and minimizing churn. You don’t know what you don’t know—and for Userpilot users, that’s a real problem. Userpilot provides no way to see trend analyses of common frustration points or suggested replays. Pendo has all of these, and more.
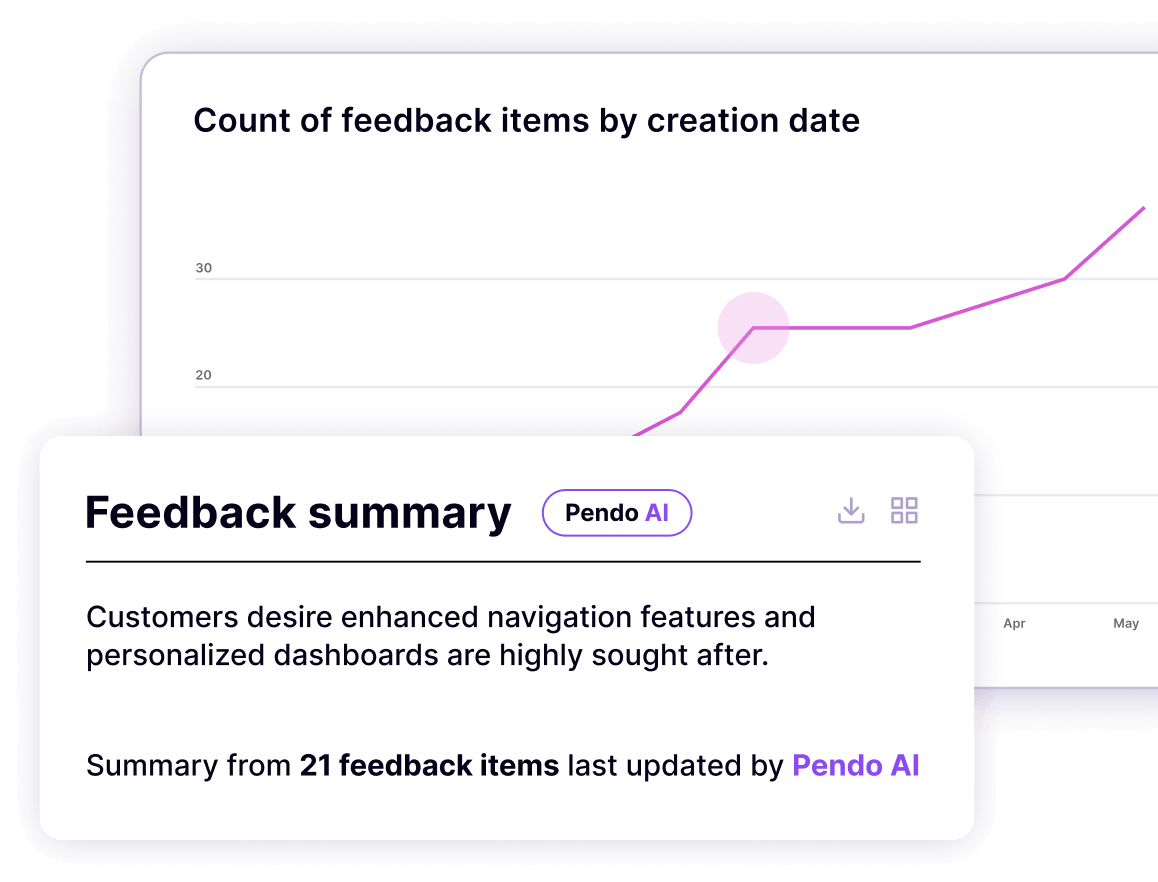
6. Does my roadmap have the right priorities?
What should your team’s roadmap prioritize this quarter in order to increase revenue and reduce rusk of churn? How do you know you’re making the right investments in your product’s future at the right times? If you’re using Userpilot, you simply don’t know. Userpilot lacks a unified prioritization framework, and users aren’t able to receive AI-driven recommendations to inform roadmap decisions.
Pendo combines usage analytics, frustration signals, and AI-powered qualitative feedback (in-app polls, NPS responses, etc.) through its Listen product to give you a full picture of user sentiment. You can filter by account types and their revenue if you want to get even more granular on what to build.
Connecting your product performance to business outcomes: Cross-sell, product-led growth, and more
7. Which features are “stickiest” across different user segments?
Which of your features see the highest amount or percentage of users coming back over daily or monthly time horizons? Userpilot lacks retention or stickiness insights in a single view. It also doesn’t allow you to see how stickiness compares across various user segments.
With Pendo, you can easily compare usage and engagement across multiple features or events in a single view and measure event frequency, median usage, or repeat engagement for any feature by any user segment. You instantly know what drives habitual behavior vs. one-time use.
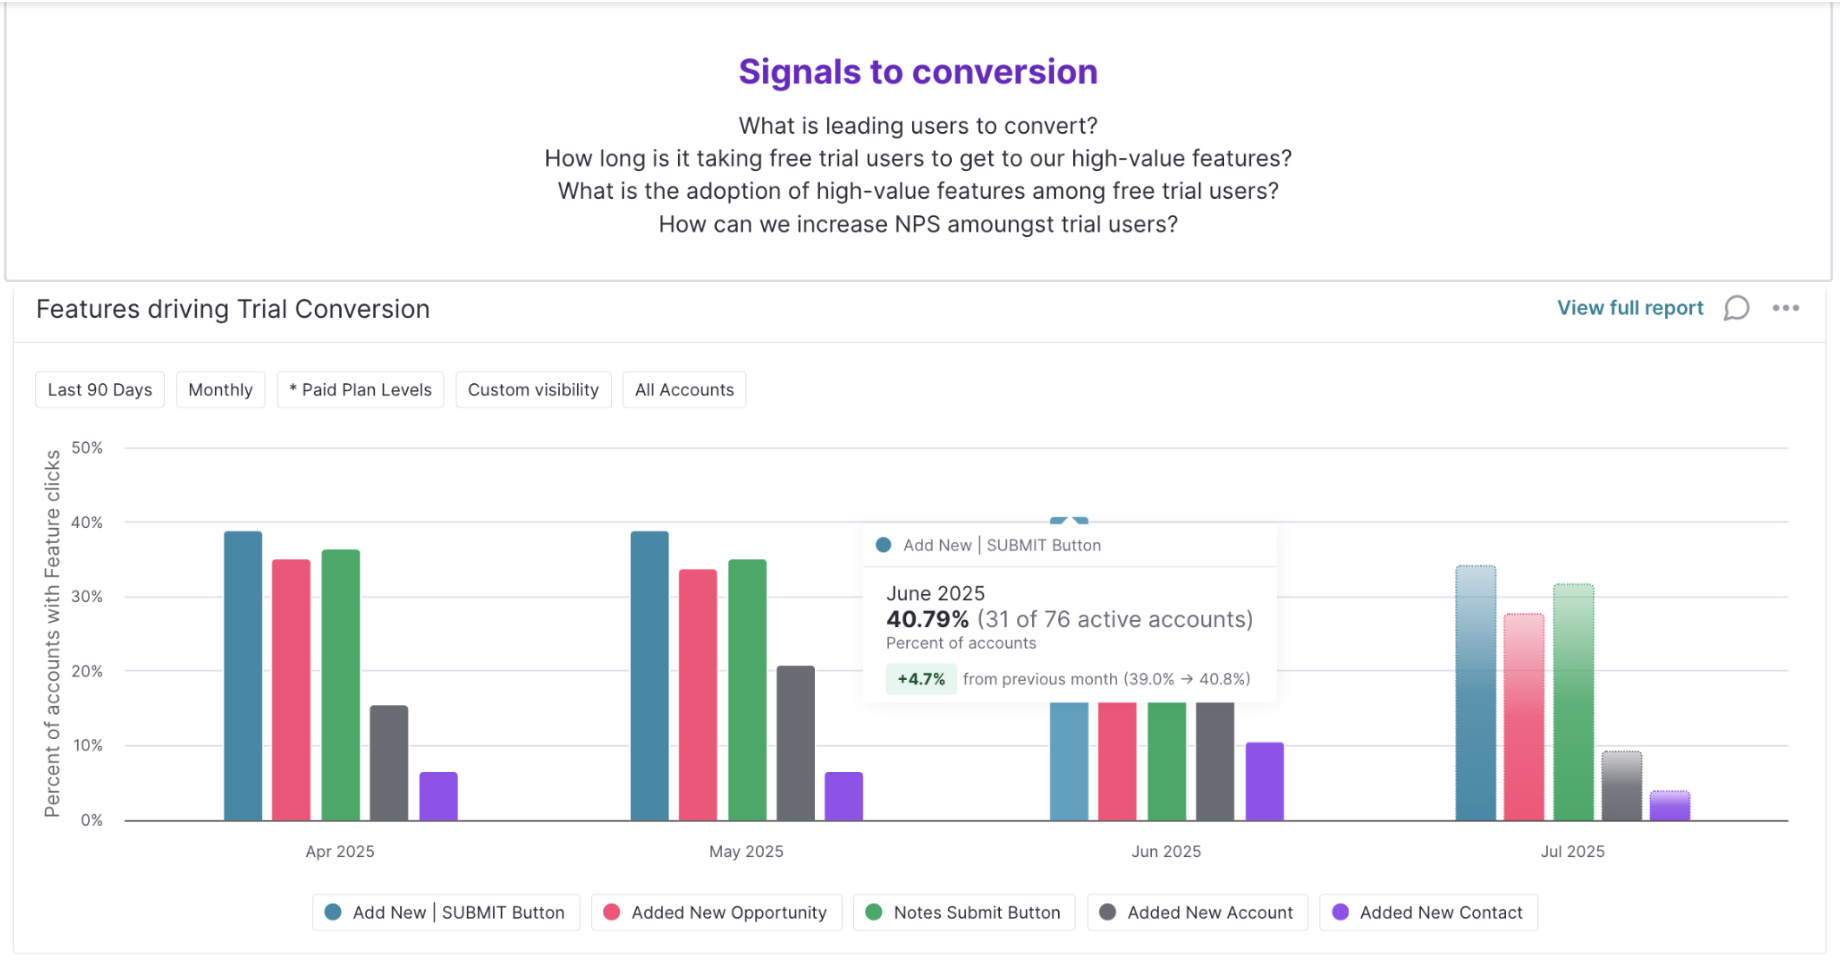
8. Which features move the needle most on conversions from trial-to-paid?
If you want to increase conversation rates from free to paid or standard to premium, you need to identify the feature or set of features that get trial users to “aha” moments most. Userpilot offers no way to compare upgrading vs non-upgrading customer segments in singular view for comparison and tracking. And has limitations in how many events you can compare in a single report. With Pendo, you can group and compare these segments and features in one report to quickly spot the distinguishing behaviors and usage that ultimately lead your product-led growth strategy.
9. What percentage of trial users performed a core event in their first week?
A core event is any key action that signals meaningful engagement with your product. It could be anything from viewing vital pages to completing significant workflows. Completing a core event or set of core events is another indicator of conversion, so it’s important to keep a finger on the pulse of your trial user behavior on that front.
For teams wanting to know what percentage of their trial users are completing core events in their first seven days or other time period, Userpilot comes up short. While the information is technically in there, it requires manual extraction and calculation (adding your own formulas) to arrive at. Pendo, in contrast, provides teams ready-made formulas and dynamic segment/date filtering that answers this question, so you can see how effective, for example, your trial onboarding motions are.
10. How does usage this quarter compare to last quarter for my key accounts?
It’s important for teams to know whether and how strategic target accounts are utilizing their product. A sudden decrease in month-over-month usage, for example, could indicate unaddressed frustrations and churn risk that should trigger a customer success team to proactively check in. Userpilot offers no multi-date comparison for user behavior reports. Pendo instantly shows behavioral trends of chosen segments for multiple date ranges in a single report.
When it comes to what Userpilot provides vs. what Pendo does, the contrast is clear. Why waste money on a product that won’t give you the insights you need? Try Pendo for free today.
![[object Object]](https://cdn.builder.io/api/v1/image/assets%2F6a96e08774184353b3aa88032e406411%2F39f3ccde352b460cbf348ccc952054cd?format=webp)