
Product Managers continuously aim to provide the best in-app experience to their users. An important aspect of this is the ability to make informed decisions about enhancement using data gathered from the user’s habitual usage of the product. These analyses are at the heart of data science projects at Pendo that investigate feature enhancement.
Guides are a very sophisticated feature of Pendo that allow Product Managers to give users a walkthrough of important features and new launches in-app. Recently, we made some changes to our Onboarding Guides and wanted to measure their effectiveness.
The Guides Details page in Pendo has all the data we needed to dive into the analysis. We pulled data from all guide events with a status of Displayed. Visitors and what Steps they saw with Average Time Per Step, First Time Views and Repeat Views, if any were some key factors considered. The Visitors Per Guide Step was also used to analyze any impact of walkthrough length on guide effectiveness. We then pulled the data into R and used some very neat packages for analysis and visualization that come with it.
Some questions we set out to answer were:
What length of walkthrough guides is most effective? Did users actually complete the guides and was it worth the effort put in to set them up? Do segmented guides perform significantly better on completion rates? Are the Pendo Onboarding guides more effective because of the changes made to certain steps?
We took a years worth of data, of all the users who started a guide, and wanted to first understand how many completed it.
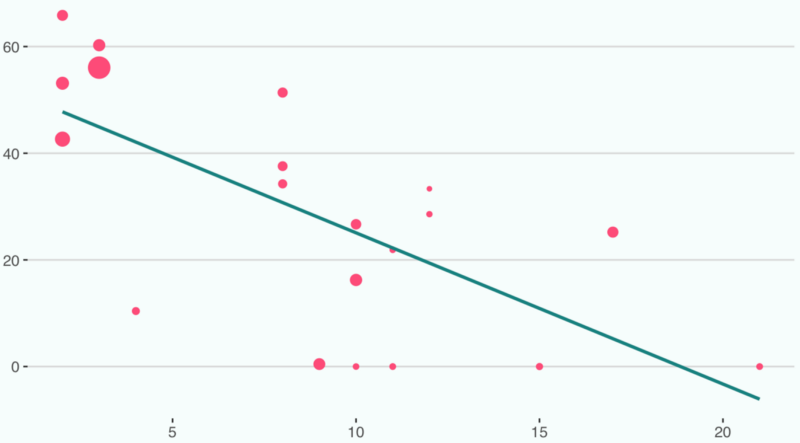
No surprises about the trend here! Shorter guides tend to have higher completion rates (as well as total visitors) on average.
Successful guides tend to be:
Short. Guides between 2–4 steps in length had completion rates of nearly 50%. Guides with upto 8 steps attracted a decent size of visitors in absolute numbers as well as completion rates of 45% on average. Those with 9 or more steps saw both dwindling completion rates and visitor numbers.
Segmented. Segmented guides, those that target a set of users based on selected criteria, have higher engagement rates by at least 10 percentage points on average than non-segmented guides.
Walkthrough guides that are segmented and upto 8 steps in length are the sweet-spot between creating enough steps in your walkthrough to guide users while still achieving good completion rates.
We then checked for a relationship between step length and repeat views of guides.
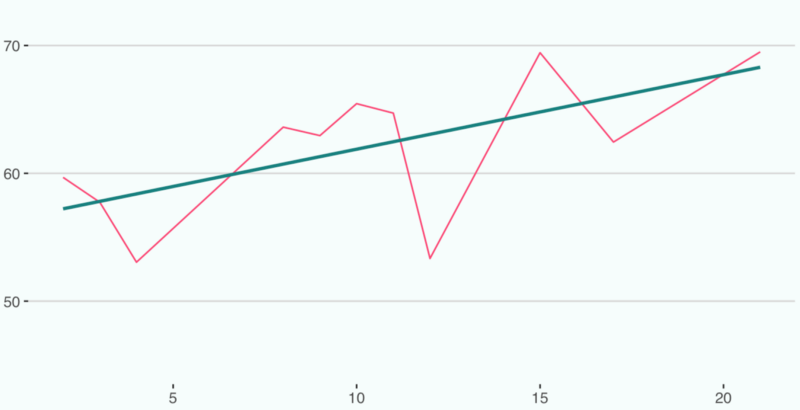
As a trend, longer walkthroughs were associated with higher rates of repeat views of guide. Classifying repeat views as a positive or negative outcome may be subjectively dependent on the guide itself. For example, if a guide teaches users something about a specific feature, it may be nice that they’ve returned. Doing A/B testing may be helpful in understanding:
Why users return to certain guides? Would it be helpful to provide more content to users within the walkthrough?
Here is how we at Pendo have used these findings:
The Product team was excited to find that changes made to certain guides had boosted completion rates. Customer Success was happy to take back information to customers about what they can do to set set up successful guides in their applications. Sales is using onboarding guides engagement during free trials to predict conversion to paying customers.
Mo money mo problems More data — more questions.
Measuring effectiveness so far has meant analyzing whether users completed the guide. Our next step will be to study effectiveness in terms of an associated outcome for each guide i.e. whether viewing a guide led the user to engage with certain pages or features defined in the guide. We’re always dogfooding at Pendo to improve the product and find interesting insights to share with you. Look out for our findings!