That’s the question monthly active user (MAU) growth aims to answer.
Understanding the current health of your product’s growth is the first step to attracting and retaining new users.
But in a sea of product usage data, KPIs, and qualitative feedback, understanding your growth isn’t so straightforward. Industry, region, company size—there are many factors at play.
What is monthly active user growth?
An ‘active user’ is anyone who interacts with your application during a period of time. Monthly active user (MAU) growth rate is the percentage change in the number of active users coming to your product.
Here’s how we measure MAU growth:

You can also measure active user growth in shorter periods of time:
- Daily Active Users (DAU): How many users log into your product on a given day
- Weekly Active Users (WAU): How many users log into your product on a given week
- Monthly Active Users (MAU): How many users log into your product on a given month
An ‘active user’ is anyone that interacts with your application during a period.
Why you need to track MAU growth
Typically a leading indicator of revenue, MAU growth helps product teams understand if users are getting value from the product. Spikes in MAU growth may reveal a runaway product success, while sudden drops may expose issues in your application, like bugs or outages.
But tracking MAU growth does more than just reveal the number of users visiting your platform. It shines a light on broader retention and satisfaction trends, and shows how effective your marketing and retention strategies are. By tracking this KPI, you can inform your resource investments, fine-tune growth and retention strategies, and forecast your product’s future.
What’s considered “normal” MAU growth?
Understanding what your MAU growth means involves more than just looking at the numbers. It requires a contextual deep dive into what drives these figures, the patterns behind user activity, and the external factors (like industry, region, and company size) influencing these trends.
Regardless of industry, company size, or region, MAUs are growing by an average of 3% over six months. In other words, products with 1,000 users will tend to add 30 new users over a six-month period.
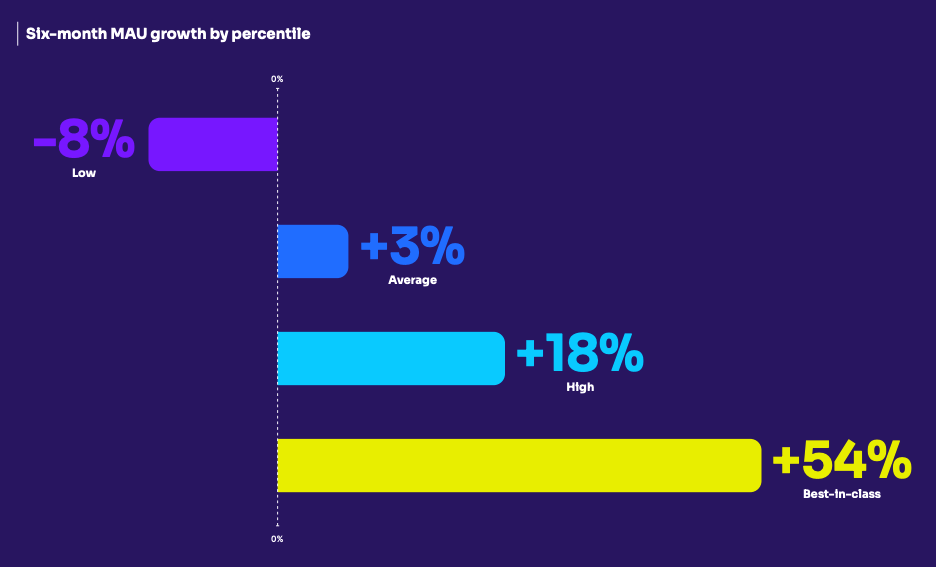
Best-in-class products, or the top 10% of products, are seeing MAUs grow by 54% over six months. That’s 18x faster than average.
How does your own MAU growth rate compare, and what should you take away from your numbers? Here are some key considerations as you interpret MAU growth.
What’s impacting your MAU growth?
Product features
If user growth increases following the announcement or release of a key feature, you could infer that the feature—and potentially others related to it—are highly desired, and thus more likely to be broadly adopted. This is valuable information for the product team, and also arms customer success managers (CSMs) with valuable proof points to bring into conversations with at-risk or low-adoption customers, in an effort to encourage them to try the new feature for themselves.
If growth is stagnant following a release, this could signal a lack of awareness about the new feature. Work with the marketing team to deploy promotional in-app guides encouraging users who haven’t engaged with the feature to explore it for themselves, or to ask them what other features they may want to see in the future.
業種
Understanding the average growth rate in your industry can help contextualize whether your active user growth rate is above or below average. Your market, target user base, and job-to-be-done also play a significant role in growth: In a rapidly expanding market (or for a newer product), a 3% growth rate might be considered slow. Whereas in a saturated market (or for a well-established product), this growth rate is pretty impressive.
Active user growth all depends on your industry
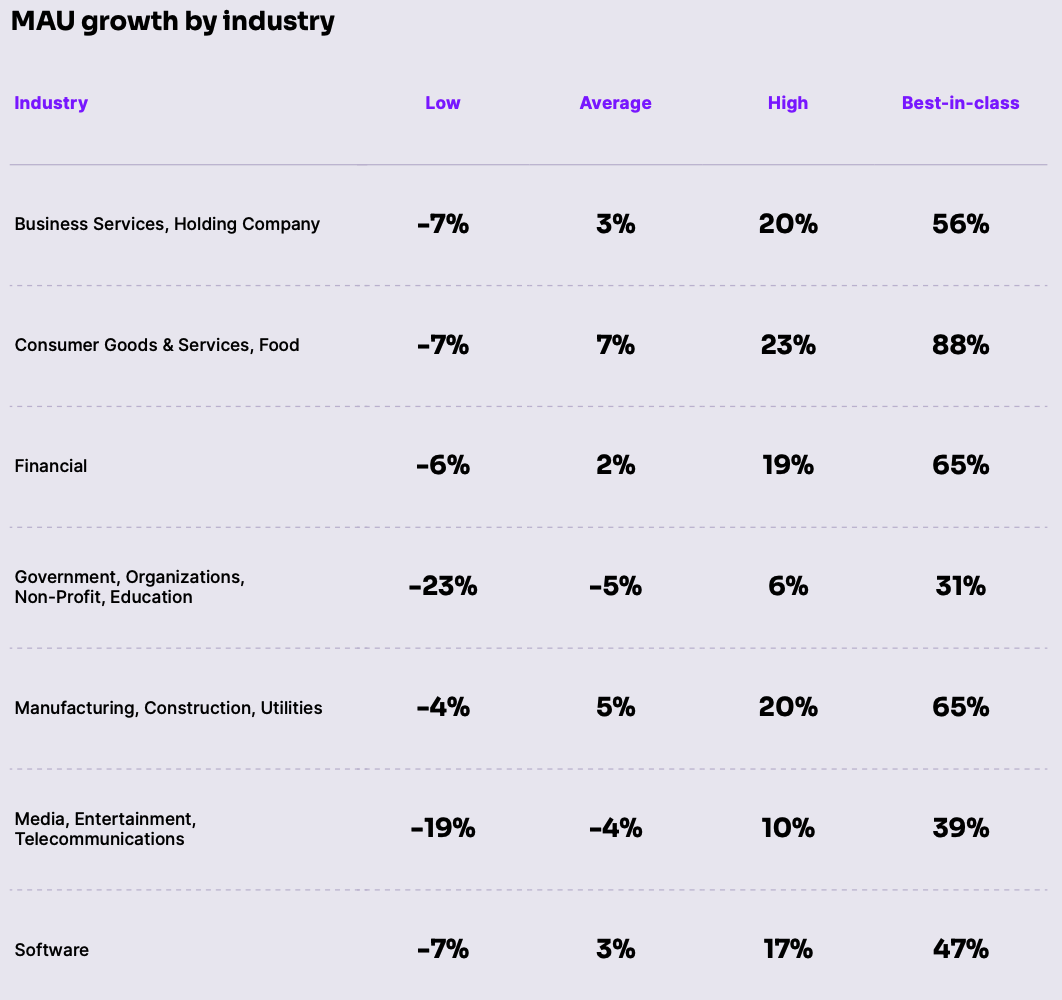
On average, Manufacturing (5%) and Consumer Goods (7%) are adding the most active users. Surprised? Don’t be. Manufacturing may have fallen behind the digital transformation curve prior to 2020, and their legacy processes saw major improvements during the pandemic’s digital acceleration.
Meanwhile, Media (-4%) and Government (-5%) are losing the most active users. Media is a competitive industry, with new players entering the market every week.
会社の規模
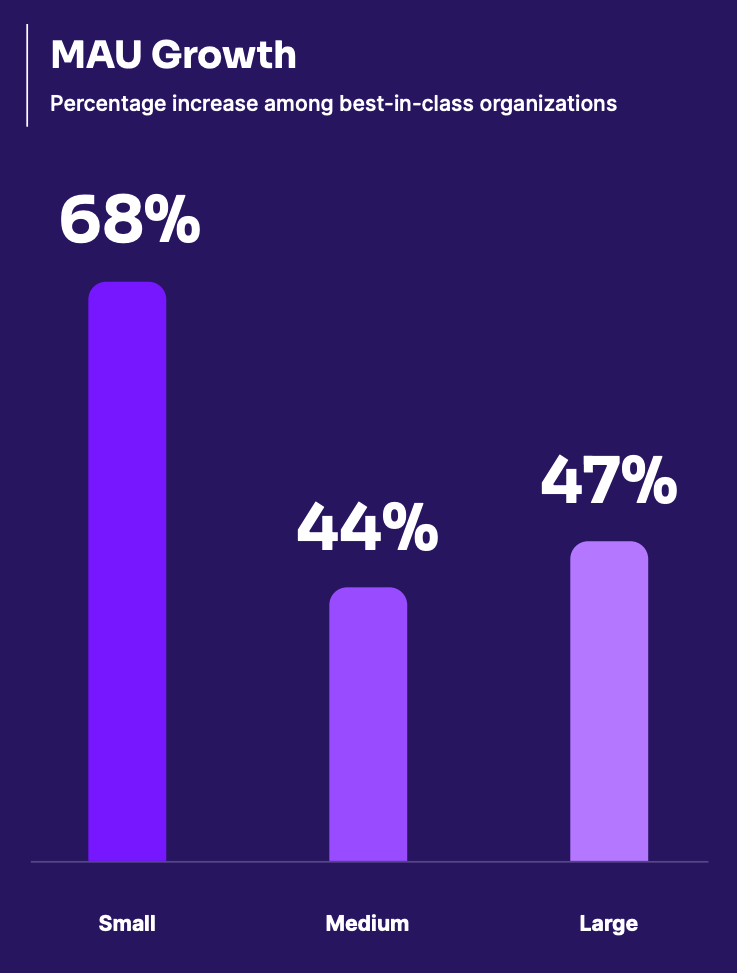
The bigger the company, the more resources you have to support growth. Startups typically don’t have the resources or headcount across customer success, marketing, and sales to support active user growth in the way larger businesses do.
Enterprises, on the other hand, likely have a well-oiled revenue engine. They’ve been around the block, and they know what strategies and messaging will effectively increase active user growth.
Big, best-in-class companies are growing 23x faster than average
Companies with more than 2,500 employees have higher MAU growth, on average. Though large companies may already operate within a saturated market, they also have more resources to acquire new users—via marketing, sales, and growth teams. Bigger budgets, brand recognition, and a drumbeat of new features all uplift MAU growth.
Region
The geography of your user base and product may be impacting user growth more than you realize. As you evaluate active user growth, consider what markets you’re adding users in: Are you gaining many users in a new market, or slowly adding users in your current ones?
How can you improve active user growth?
- Use product analytics: To grow your product’s active users, you first need to understand what you’re up against. Use your product data to understand user behaviors and identify points of friction. Tools like funnels, heat maps, and A/B testing can help you identify issues, and allocate resources to improve your product.
- Segment communications: Capture information about your users, such as job to be done, management level, and title, to segment your audiences. This way, you’re showing relevant information to the right people (and can avoid user frustration or in-app guide fatigue).
- Automate in-app onboarding and walkthroughs: From day one on, you should be showing the value of your product via in-app guides, walkthroughs, resource centers, and other tools. Build enduring habits in your product by guiding segments towards workflows and tools most relevant to them.
- Offer freemium and free trial offerings: Product-led organizations rely on their product, rather than marketing methods, to drive user growth. An easy way to add active users? A lower-friction freemium offering that lets users try the product before committing to it.
- Capture and apply user feedback: Understanding what your users want, and acting on their feedback, is a core pillar of active user growth. Users are your best source of ideas. When you listen and act on what they want, you can help build enduring habits for users and encourage advocacy.
- Focus on user acquisition. Brainstorm strategies to attract new users with your sales and marketing teams, and learn what’s working. If you have a free product, think about how you can use in-app messages to encourage upgrades at natural points in the users’ workflows.
Plot your product’s MAU growth relative to your peers in Mind the Product’s interactive benchmark tool.