
As data scientist here at Pendo, part of what I do is provide real-time analytics so that the product team can “dog-food” them and determine how insightful and actionable they are, for us as a team as well as for our customers. Especially during our preliminary research before we start building a new feature, I help the team answer questions on customer usage patterns and trends that they cannot easily obtain from the application.
I use our aggregation API to access Pendo application data using R and Python, which I use for the majority of my analyses. Our help center has some great documentation on accessing data using our API and aggregation endpoints using Python. (For those whom this is of interest, both these programming languages are remarkably versatile, but I use R heavily for statistical analyses and Python for its graphing capabilities.)
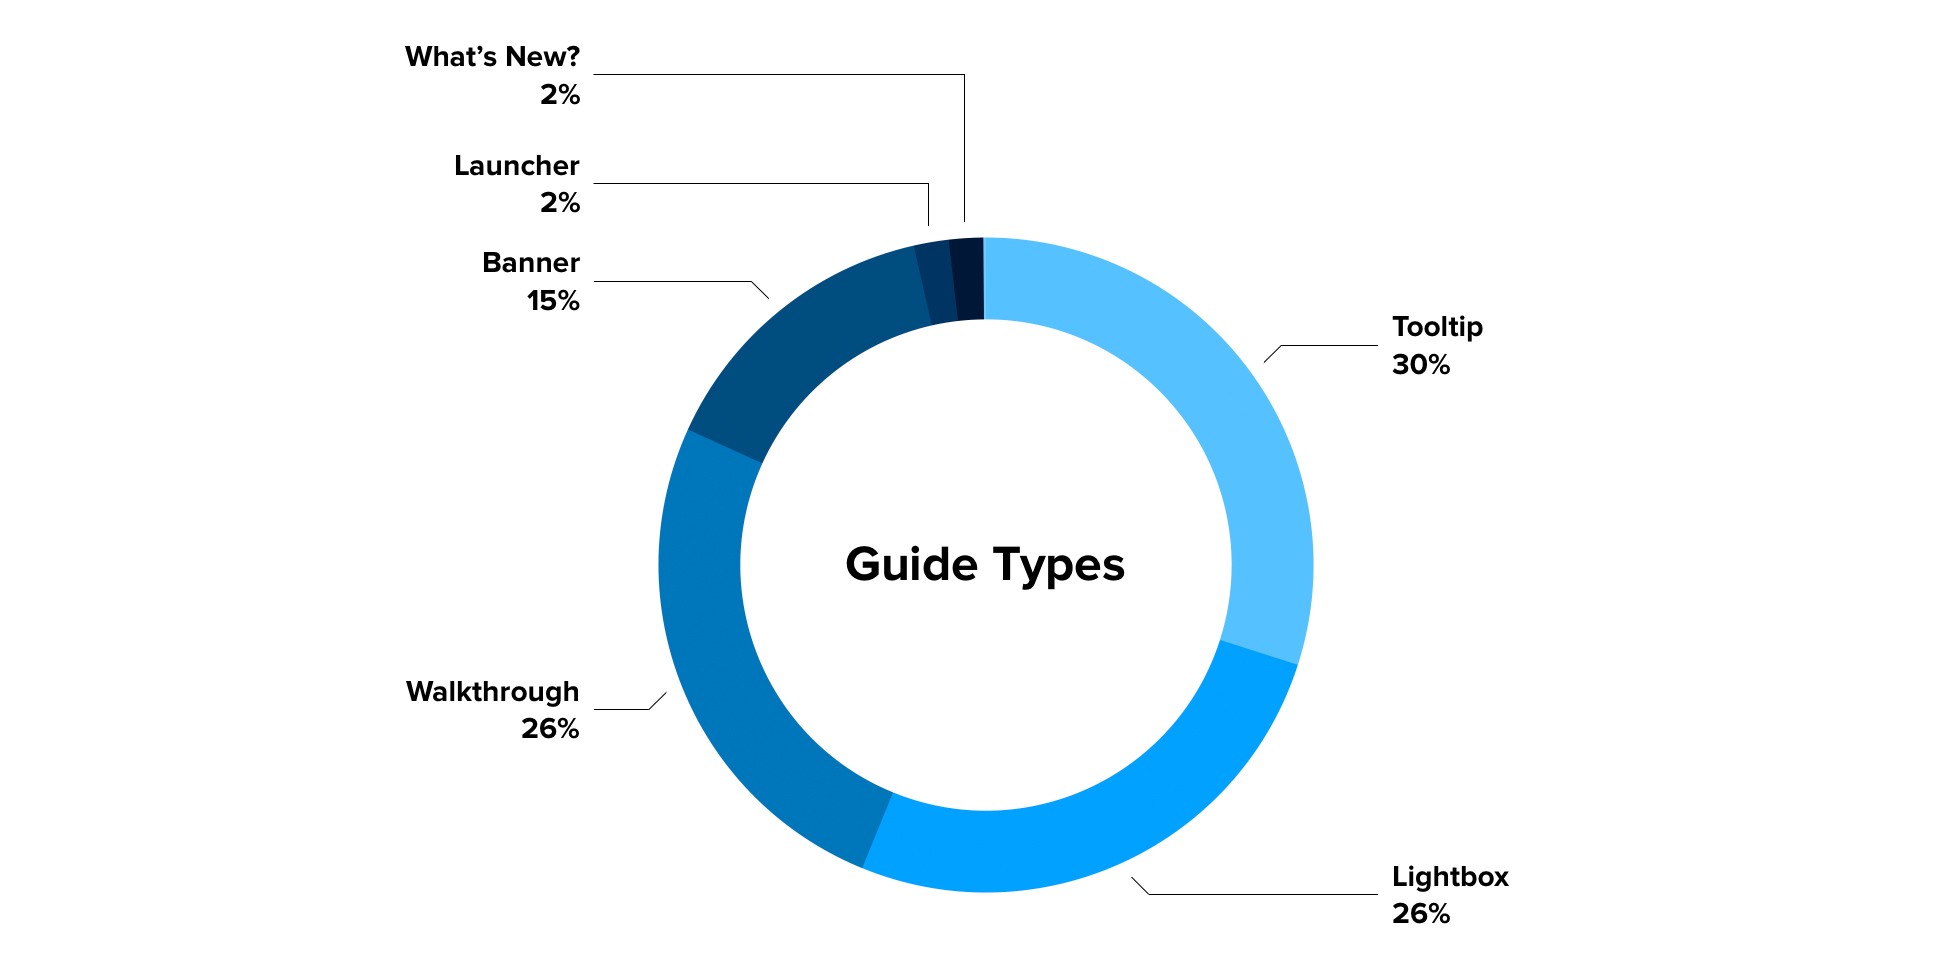
As a simple example, for a guides redesign project, because the type of guide used meant building things in different ways, the team wanted to determine which guide types were being used most frequently by our customers. This would help prioritize these features and better understand how our customers use them.
To answer this question, I queried the guides source and obtained data on the guide types used. I then summarized the data in Python and passed it onto the team (summary in the pie chart below). Tooltips are the most frequent guide type used, at 30%, closely followed by lightbox guides (26%) and walkthroughs (25%).
Tools like R and Python have nifty packages that allow for automation of data access via API endpoints, which we and our customers use. If you’re interested in an example of the R code I used, to get started in accessing data via our aggregation endpoints, you can find it here