When product ops is an established function, they’re responsible for generating insights to inform product strategy and advise decision makers. But as we’ve researched the role more, we’ve found that product ops is also often tasked with connecting the product to a company’s top and bottom lines. It’s easier said than done, of course, but the best way to understand if a product is doing what it’s supposed to do (i.e., generating and growing revenue) is to understand how it’s being used, and then continuously target, iterate, analyze, and repeat.
More specifically, teams need to be able to visualize product usage over time and by different user segments in order to know where the product is succeeding — and where it’s falling short. And with the rise in product ops and availability of product analytics tools, there’s now a dedicated function to own this continuous customization and optimization process.
以下では、Pendoデータエクスプローラーを使って、プロダクトのコホート別に行動を視覚化、追跡、比較し、プロダクトオペレーションのプロ(実際は、誰でも)がプロダクトを全体的な戦略に結びつける方法を紹介します。
データエクスプローラーを使用した現在の行動の評価
Maybe there’s a certain product area that isn’t getting as much love as you want, is consistently included in detractors’ NPS comments, or is the source of a ton of user feedback.
プロダクトチームは、さまざまな顧客セグメントが特定の機能をどのように利用しているかをはじめとして、プロダクト分野が現在どのように使用されているかを理解する必要があります。データエクスプローラーを使用すると、プロダクトデータをもとに、特定の分野のページや機能を操作しているユーザーの確認、特定のガイドを表示することによる使用状況への影響の特定、プロダクトを十分に活用していないユーザーの興味喚起ができます。
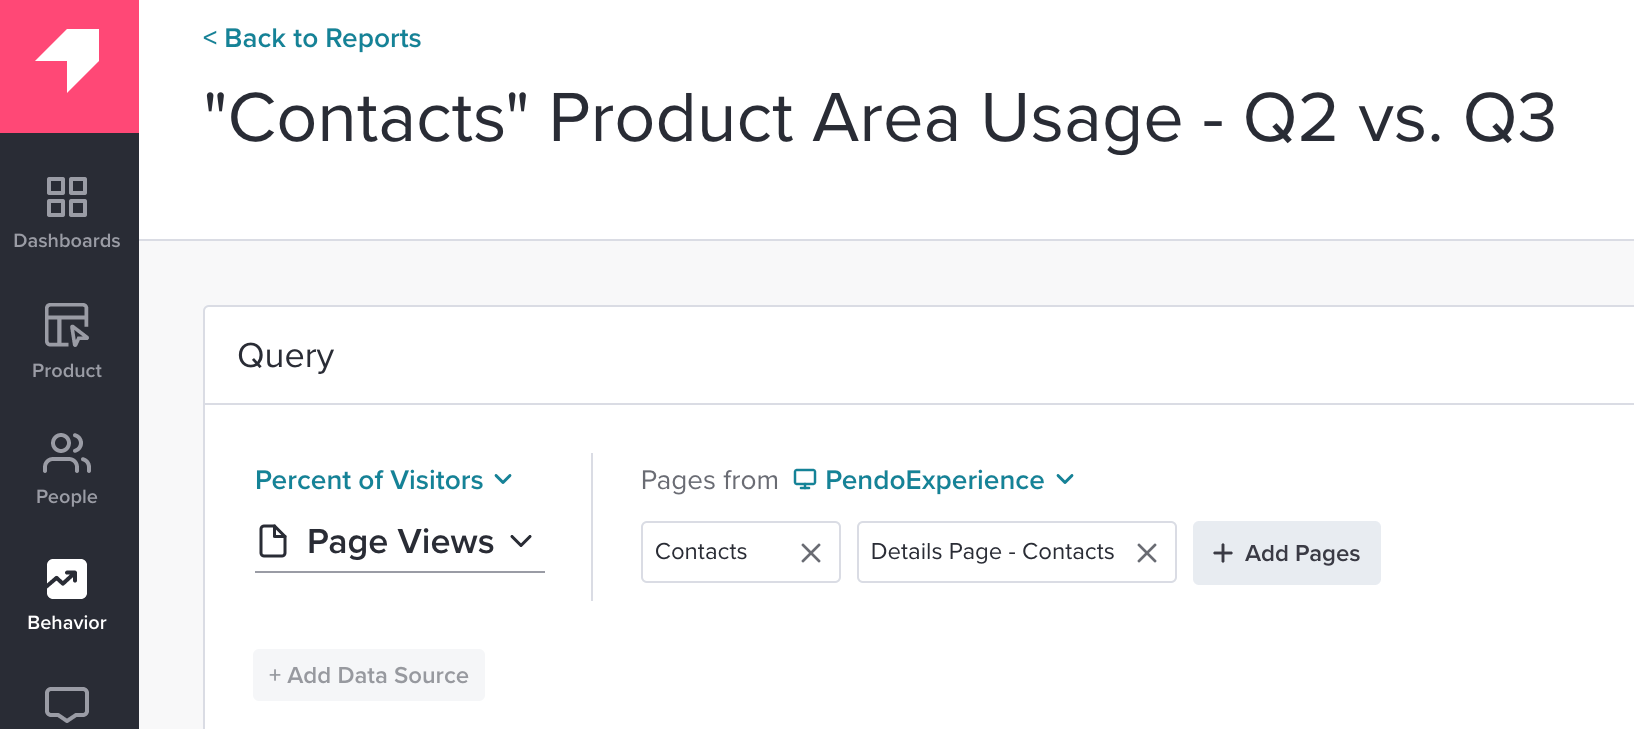
また、特定の時間単位の比較(たとえば、機能の使用状況が前四半期と比較してこの四半期でどのように変化したか)など、ユーザーの操作が経時的にどのように変化したかを表示することもできます。
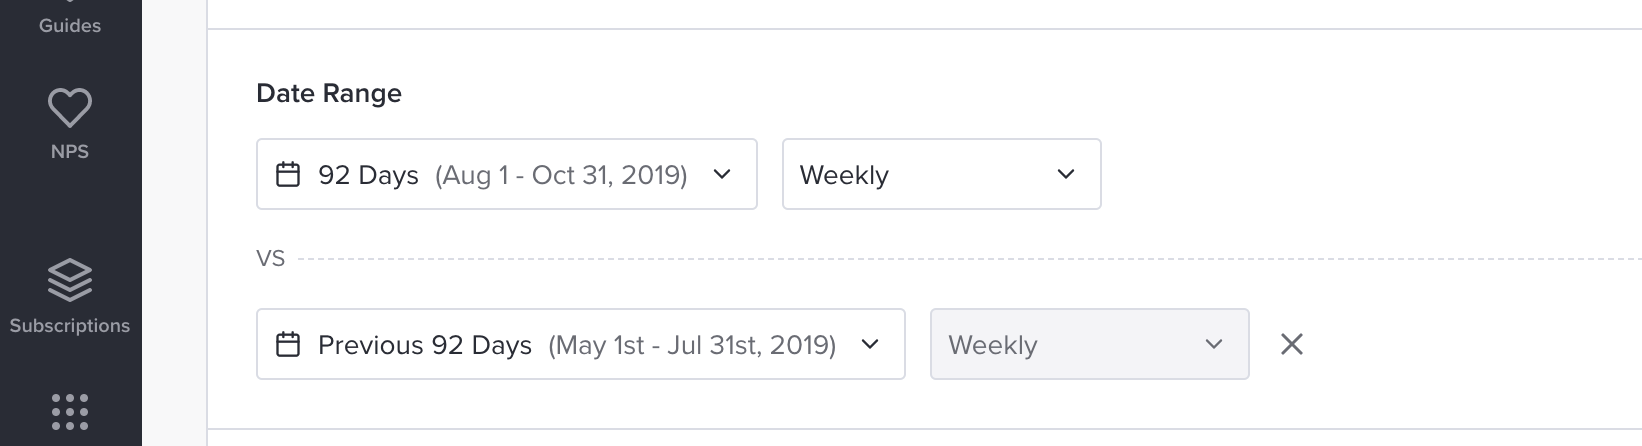
This is particularly helpful if you’ve released an improvement or new feature within a certain product area. Seeing a shift in behavior of a user group before and after the release can indicate if the change is making the impact (e.g., increase in feature clicks, page views, or track events) you desired.
行動の背後にある「理由」の調査
新機能のローンチ後にユーザーの操作が増えない場合は、この情報をもとに詳細を調べることができます。単にユーザーが新機能に気づいていないだけかもしれませんし、誰がその機能を使うのかという当初の仮説が間違っていたのかもしれません。
ユーザーの行動の背後にある「理由」を調べる際に、データエクスプローラーの追加の[セグメント(Segments)]パラメータと[グループ化(Group By)]パラメータを使用すると、さまざまなタイプのお客様の傾向を把握するのに役立ちます。たとえば、新しい機能に関するガイドを参照したセグメントと、そのガイドを参照しなかったユーザーセグメントの、機能の使用状況を比較できます。
下の図では、「連絡先の作成」ガイドを見たユーザーは、ガイドを見なかったユーザーよりも[連絡先(Contacts)]ページを多く見ています。この例では、[連絡先]ページの使用率を向上させたければ、最初にガイドを表示しなかったユーザーに再発行することを考えることができます。
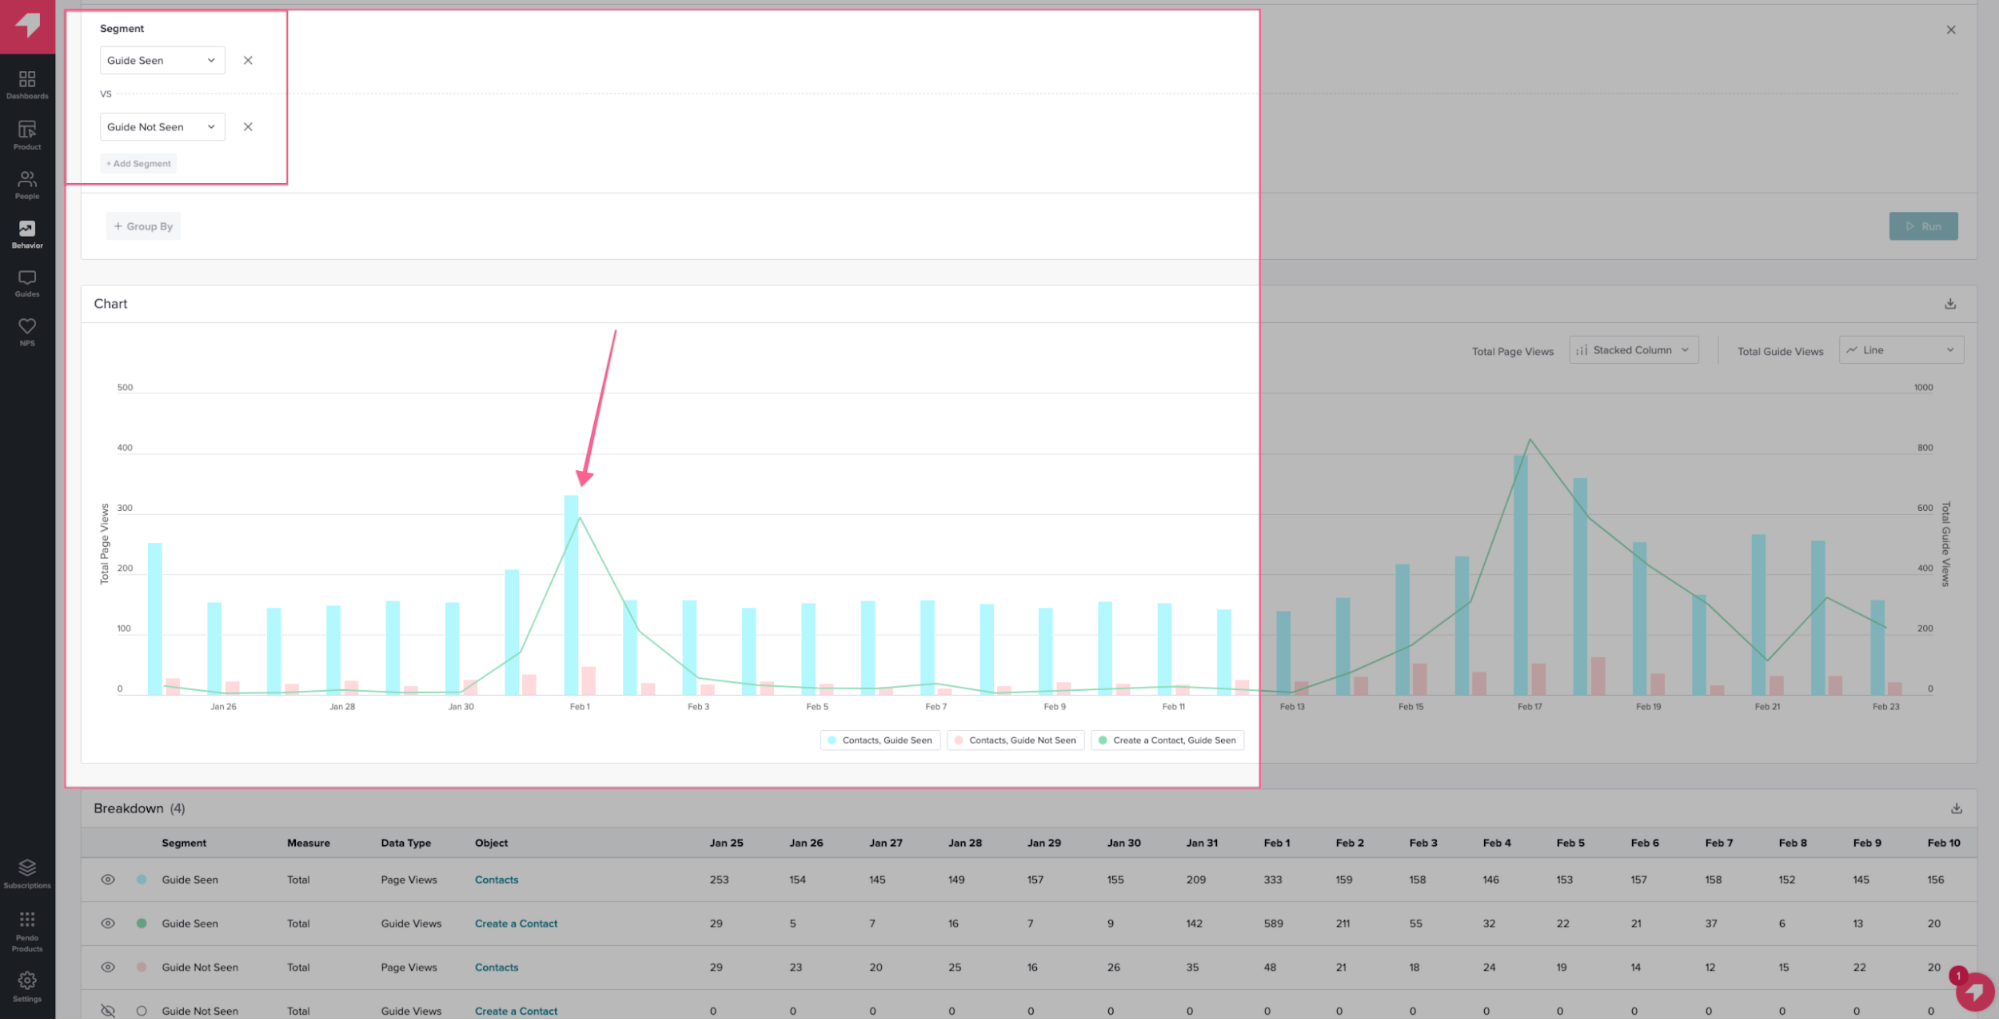
特定のアカウントが最初のガイドを受け取っておらず、ガイドで強調表示している機能の使用率も低い場合は、そのようなアカウントのリストを簡単にエクスポートして、カスタマーサクセスやアカウント管理の取り組みを通じてアカウントを引き付ける際のトピックとして使用できます。
Additionally, if you find that specific users (or visitors) who have not seen a guide are also trailing in usage of that specific feature, you can easily create a new visitor segment in Pendo. This way, you’re able to launch an in-app education campaign and target specific guides to this set of users, encouraging them to try the feature or walking them through how to use it.
パワーユーザーの行動喚起
また、データエクスプローラーを使用して、特定の機能を頻繁に使用するユーザーを特定し、そのコホートに向けてより技術的なメッセージを提供するガイドの対象にすることもできます。たとえば、特定の機能を何度も使っているユーザーであれば基本的なことは理解しているかもしれませんが、より高度なワークフローを使用して、プロダクトの使用方法とプロダクトから得られる価値を深めるようにユーザーを導くこともできます。
加えて、パワーユーザーのワークフローは、他のお客様セグメントで(ガイダンスやUXの強化を通じて)推奨したい行動もよく表しています。パワーユーザーの経時的な行動を見ることは、機能の操作を理解するための最良の方法の1つであり、他のセグメントがパワーユーザーになるための参考になります。そうすればアカウントが拡大し、アップセルの機会も増える可能性があります。
時間をかけて、データエクスプローラーレポートを何度も見たり、ダッシュボードに追加したデータエクスプローラーの表示を確認したりすることで、そのお客様セグメントのプロダクト使用状況を評価できるだけでなく、ビジネスにとって最も重要な指標を改善するために追加の手順を実行する必要があるかを判断できます。