Testing NPS Surveys – How a Simple Change Caused a 78% Variation in Net Promoter Score Results
At Pendo we’ve been highly consistent in our outreach for customer feedback. Engaging with, and ensuring that our clients are successful is core to what we are about. So, when we added the capability to deploy NPS surveys directly in-app, we were eager to try it ourselves. To support NPS polls, we added a new “banner” guide type as well as the ability to build a segment that “randomly” targets a subset of your users. Displaying NPS surveys in a banner is a common approach, and something our customers requested as we were scoping out the feature. However, we were curious. Is this the best approach? Would we see variation in the responses if we used a different guide type to request NPS? We decided to find out.
A quick primer on NPS
For readers who are unfamiliar with Net Promoter ScoreSM, NPS is a commonly used metric to gauge customer loyalty and overall user satisfaction. Unlike other qualitative measures, NPS is a specific, calculated metric that can be measured over time, or compared across products/vendors. NPS is calculated by asking a single question: How likely are you to recommend this [product or service] to a friend or co-worker?
Respondents are prompted to respond to the question using an eleven point (0 – 10) scale indicating their likeliness to recommend. The actual NPS score is calculated by subtracting the percentage of “detractors”—those that respond 0 through 6, from the percentage of “promoters”—those that respond 9 or 10.
The experiment
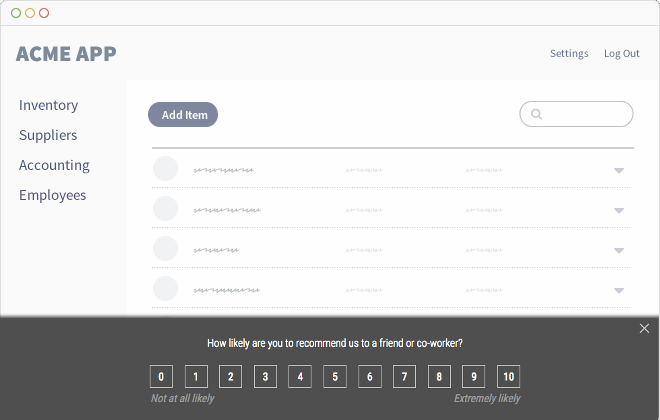
For the month of February this year, we decided to run an NPS survey. To see if the guide style had any impact on the rating, we designed an A/B test for the survey. We created two distinct sample segments of Pendo users. One sample was shown the NPS survey in a banner guide—like the one below:
The second group received the same survey, but this time in a lightbox:
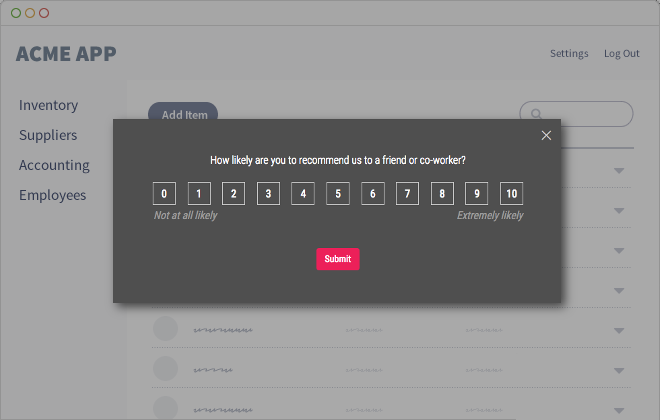
The lightbox is much more intrusive than the banner, taking up the entire screen and preventing the user from taking any activity until the guide is dismissed. We expected that the lightbox survey would have a higher response rate. The question was whether the intrusiveness of the lightbox would have a negative impact on the rating itself.
First lesson—be careful about who you target
We deployed the surveys and eagerly waited for the results. Since each individual rating also asks an open-ended question about why the user gave a particular rating, we hoped to get some additional insight into the best and worst aspects of the Pendo platform. However, one of the first responses gave us some unexpected insight into our survey design. The response coupled a low NPS score with the following comment: “I haven’t ever used the service, why would you pop this up the first time it loads?” Oops. We carefully designed the “A/B” segments to create distinct audience samples, but we hadn’t considered how long a user had been using our platform prior to serving the NPS poll. We quickly made an adjustment to the segment definitions to only target visitors who had been using Pendo for a month or longer.
This learning highlights an important issue when capturing measurements like NPS. It’s important to make sure you are only targeting people who are qualified to provide an opinion about your product. A brand new user, or one that hasn’t been exposed to your core features, isn’t able to provide you deeply relevant feedback. You will need to consider whether you want to include input from these users in an NPS survey, or if you want to use some other channel to capture the type of “first impression” feedback that you’re likely to get from them.
Survey results
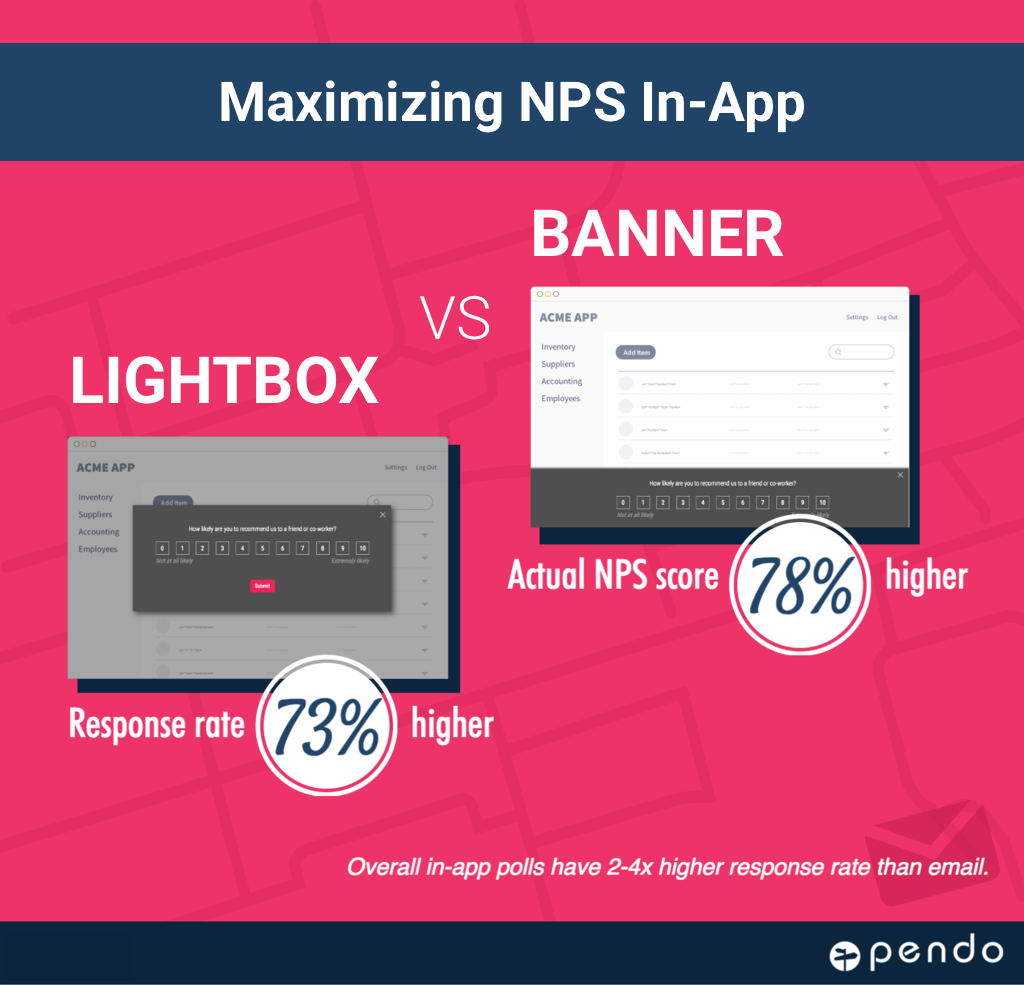
After running the survey for a month, we looked back at the results across both guide types. As expected there was variation between the two surveys. What was surprising was the extent of the variation. The lightbox-style NPS poll had a much higher response rate. Eligible users responded to the banner guide 15% of the time while users who received the lightbox responded 27% of the time—an increase of 73% between the two guides. What was even more surprising was the variation in the NPS score itself. The score calculated from the lightbox-style NPS was 78% lower than the guide served in the banner. Even with a relatively small sample size, the score difference was outside the margin of error for both scores.
The difference between the two scores doesn’t invalidate the results, but it does show how much different factors (beyond a user’s overall level of satisfaction) can influence the score. You should be cognizant of these factors when evaluating the results from any NPS survey, and avoid blind devotion to the score. NPS is a valuable metric, but it’s not the only metric for product success. NPS scores should be considered in conjunction with other types of user feedback, and with observed quantitative user behavior data captured in the application. Also, importantly, when running NPS surveys over time you should strive to ask the question in the same manner to similarly qualified respondents each time. As we’ve found, introducing variability in something as simple as how the question is presented can have an outsized impact on the results.
NPS survey follow-up
The results of our A/B test were really surprising, but it’s important not to lose sight of the overall value of NPS surveys. The summarized score is a benchmark, but the individual scores provided by users, and even more importantly, the open-ended feedback provide a lot of insight into your users. Both surveys gave us valuable feedback about areas of the Pendo platform that user love, and areas where we can definitely improve usability. NPS is a closed-loop feedback system that requires both buy-in from across the organization, and follow-up with respondents. Our Customer Success team reaches out to every respondent that expresses concerns in the surveys to make sure we’ve captured them correctly, and can address and remediate their issues. Simply capturing an NPS score is never the point. It’s about how you use the insight to improve your product success.