企業のベンチマーク調査は、進歩に不可欠な要素です。自社で成功していること(そしてもっと改善できること)についてのインサイトがなければ、成長への方向性が失われる可能性があります。しかし、多くのプロダクトチームでは、測定とデータがおざなりにされています。
お客様が同じ罠に陥らないようにするため、当社では、Pendo Oneプラットフォーム上で企業の1,100以上のアプリケーションから匿名化された集計データ*を分析しました。
Let’s take a look at enterprise product performance across four KPIs across four brackets: low (25th percentile), average (50th percentile), high (75th percentile), and best-in-class (90th percentile). We’re covering four enterprise KPIs in this blog, but you can view all nine benchmarks in our interactive benchmarking tool.
1. 月間アクティブユーザー数の増加
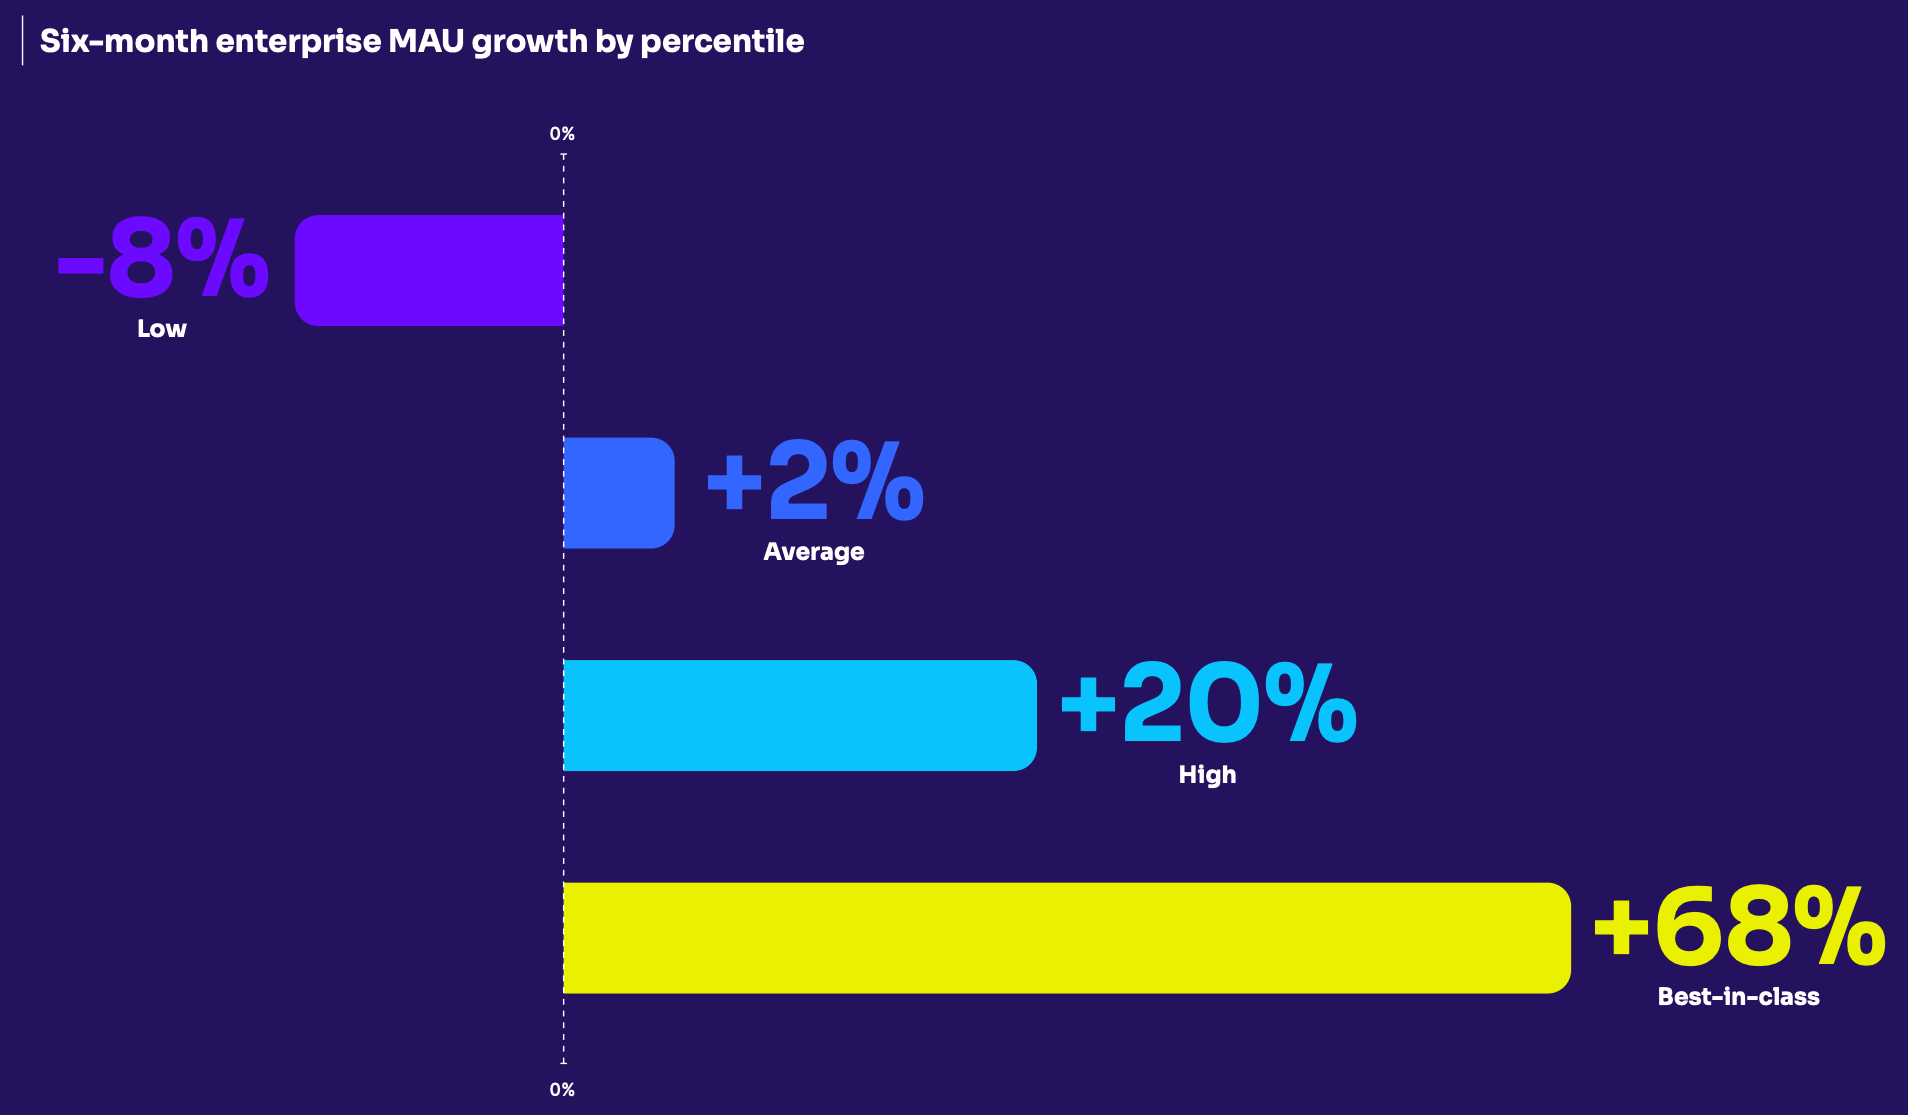
Across industry and region, enterprises are growing six-month MAUs by an average of 2%. In other words, products with 100 users will add two new ones at the end of six months. While an average of 2% MAU growth may seem low, enterprises have long-established audiences and offerings.
上位10%は平均の34倍の速さでMAUを追加
The top 10% of enterprise products are growing MAUs by 68%. Rapid MAU growth like this often follows the launch of a new product in its early days—like Meta’s Threads app.
アクティブユーザーを増やす4つの方法
- Capture and apply user feedback: Your product team should listen to users and add their ideas to your product roadmap. This is the easiest way to create products that delight and engage users.
- Educate users in-app: From day one and beyond, emphasize the value of your product via in-app guides, walkthroughs, resource centers, and other tools.
- Segment communications: Gather information about your users, and create segments by role to share relevant resources.
- Offer freemium and free trial offerings: Product-led organizations rely on their product, rather than marketing methods, to drive user growth. A low-friction, low-commitment offering is an easy way to add and convert users.
2. ユーザーリテンション
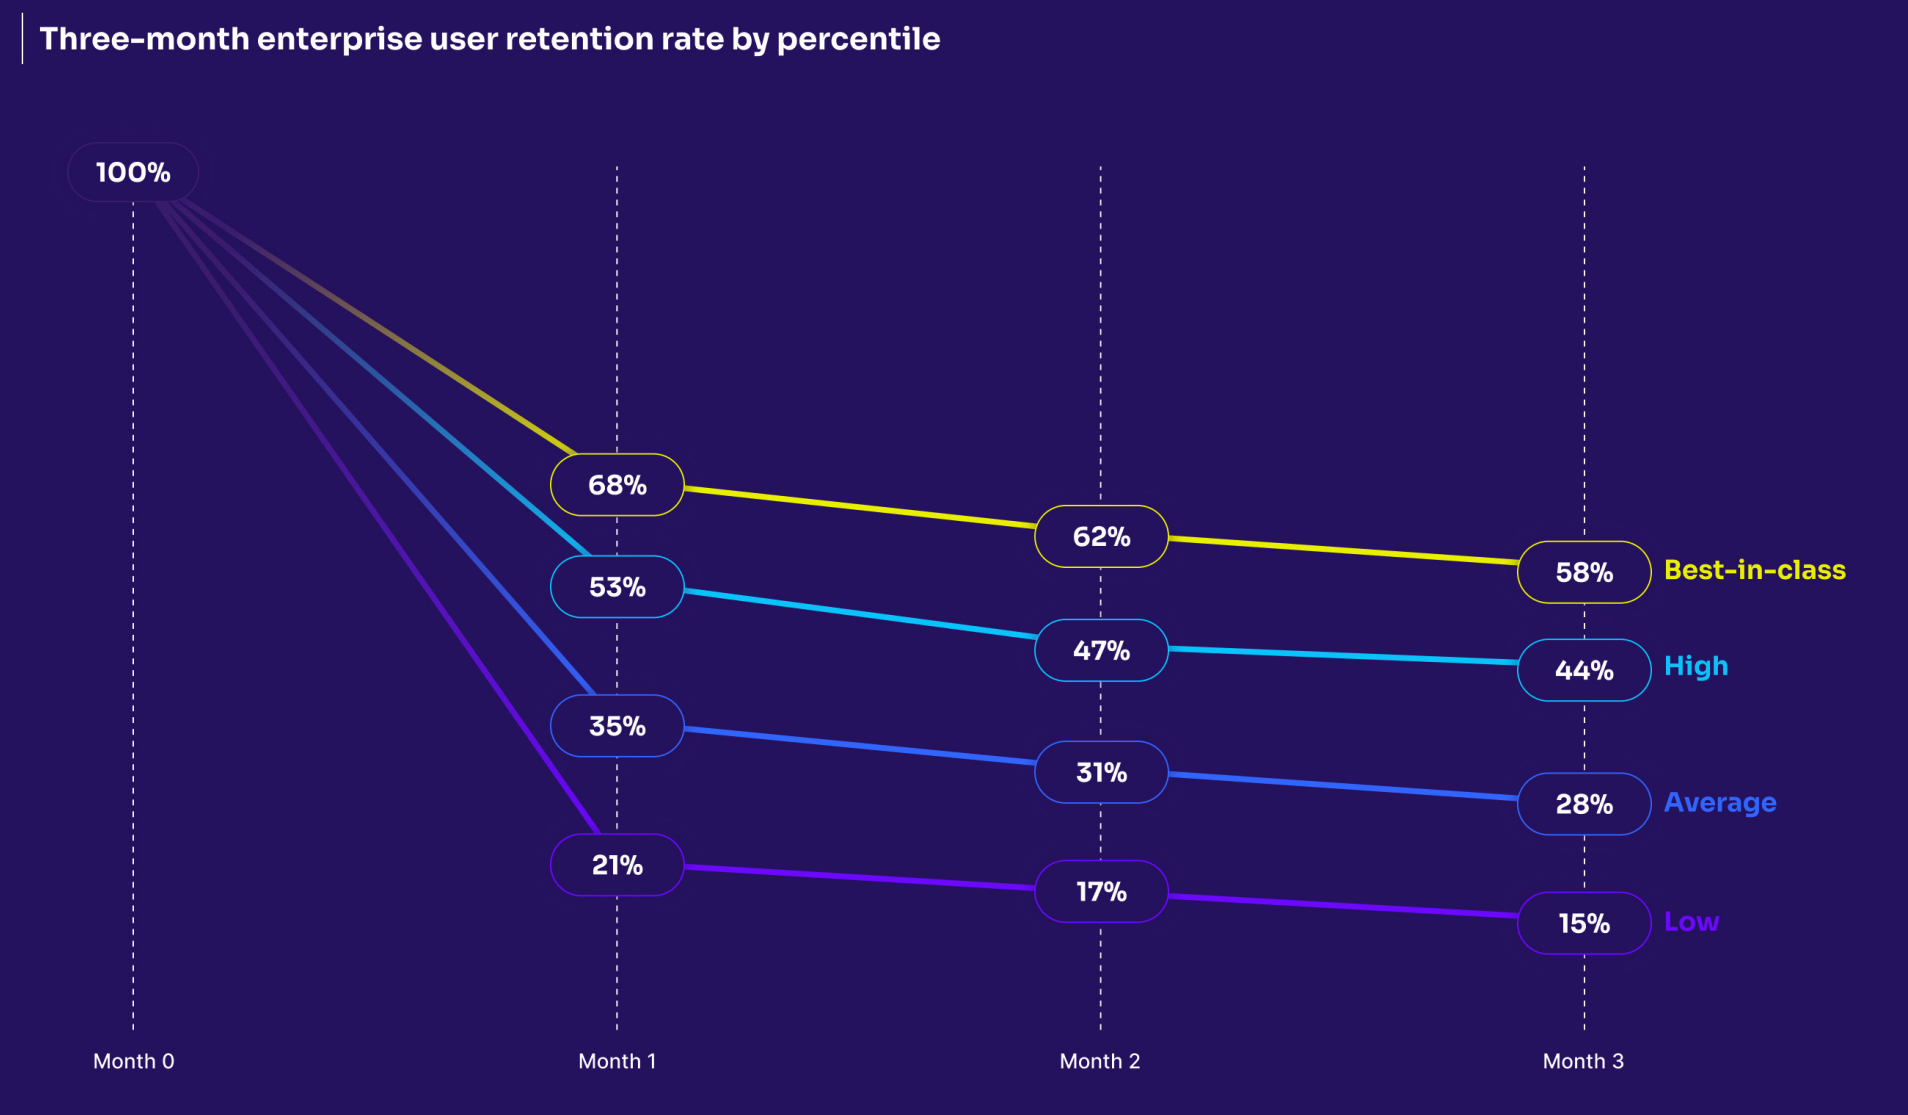
エンタープライズプロダクトの1か月後のユーザーリテンション率は平均35%で、3か月後、ユーザーの約28%はまだプロダクトを使用しています。つまり、プロダクトで100人のアクティブユーザーが増えるごとに、72人のユーザーが離脱することになります。
3か月にわたるエンタープライズプロダクトのユーザーリテンション率は28%
定着率はプロダクトの年数によって変化する傾向があります。新しいプロダクトの場合、1か月のユーザーリテンション率が35%であれば、プロダクトがユーザーに価値を付加していることを示しています。定評のあるプロダクトの場合、これにより根本的な機能上の課題が明らかになる可能性があります。
リテンションの向上はガイダンスを中心に展開
- Simplify user onboarding: When a new user logs into your product, your PMs should highlight core features, offer product walkthroughs, and link out to the resource center. See how five product teams are improving onboarding.
- Continue to add value: Nurture customers even after they’ve gotten the hang of your application. Your teams should use in-app messaging and widgets to create a product environment where users are always learning and uncovering features at their own pace.
- Put your product analytics to work: Your team can’t improve retention without defining the problems. Look at your product’s qualitative, quantitative, and visual data across different user segments. Session replay, product analytics, and feedback reveal what top users are doing, so your team can guide at-risk customers to value.
3. 機能の定着化
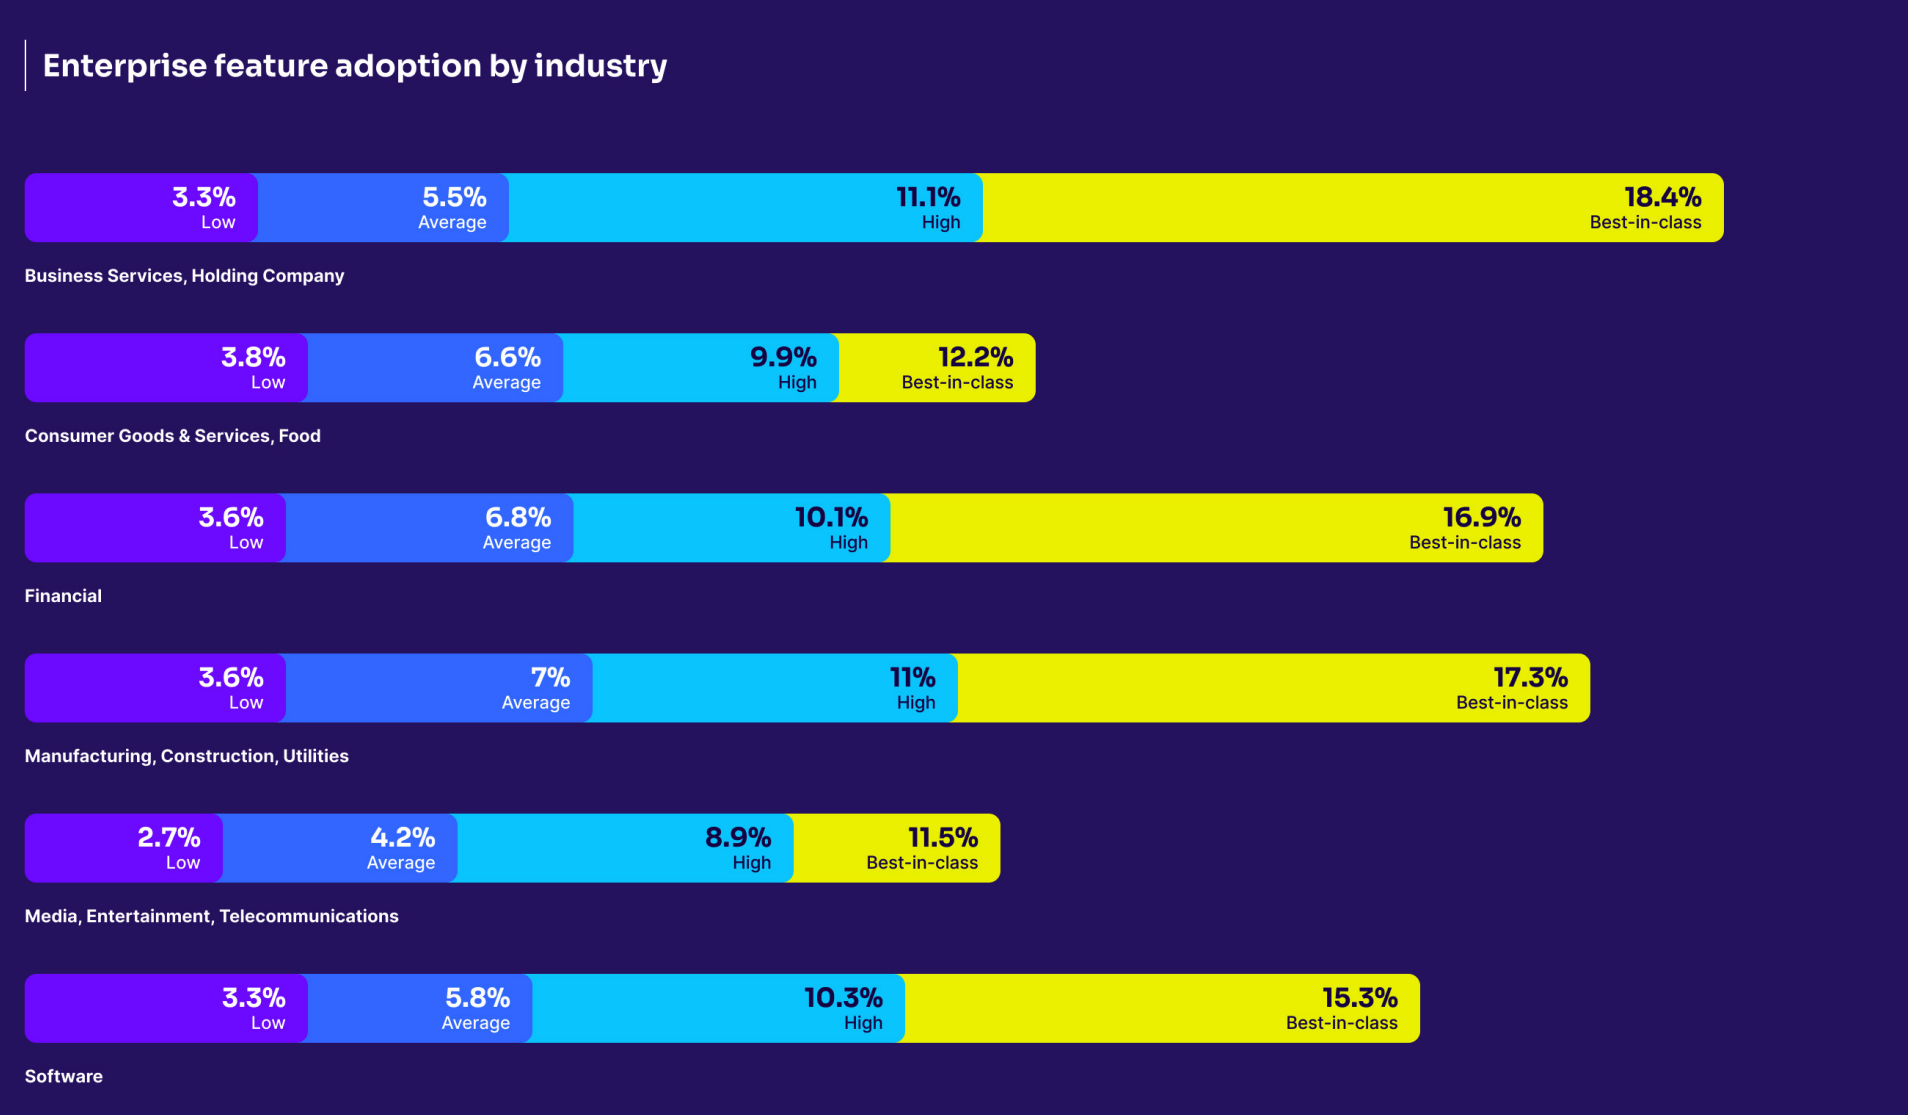
Average enterprise feature adoption for digital products is 6%. For best-in-class enterprises, this jumps to 16%. Across industries, products in the Manufacturing industry have the highest feature adoption at 7%. Products in Media are lagging, at 4%.
わずか6%の機能がクリックの80%を促進
機能の定着率を高める要因を判断する方法は対象となるプロダクト/機能の性質によって異なります。ビジネスサービスプロダクトの場合であれば、定着率が6%であればまずは成功と言えますが、ソーシャルメディアアプリの最新のメッセージング機能の定着率が6%であれば、警鐘が鳴るレベルで対応が必要です。
機能の定着化のベンチマークを超える4つの方法
- Make adoption easy: It should be as simple as possible for customers to find and use features. Once you’ve announced a new feature, create in-app walkthroughs to guide users through the desired steps—especially for features that require multiple steps in the workflow.
- Announce new features in-app: One of the best tools to promote features is your product itself. When your team announces features in-app via guides or tooltips, you reach users when and where the message is most relevant.
- Make the value and desired action clear: As your team creates in-app messages or other content about features, use straightforward language that clearly communicates their value. Then, point users to the next action you want them to take (like watching a guided demo).
- Target your communications: Not every feature is relevant to every user. Your PMs should create segments within your product experience platform by role, permissions, and technical proficiency.
4. 粘着性
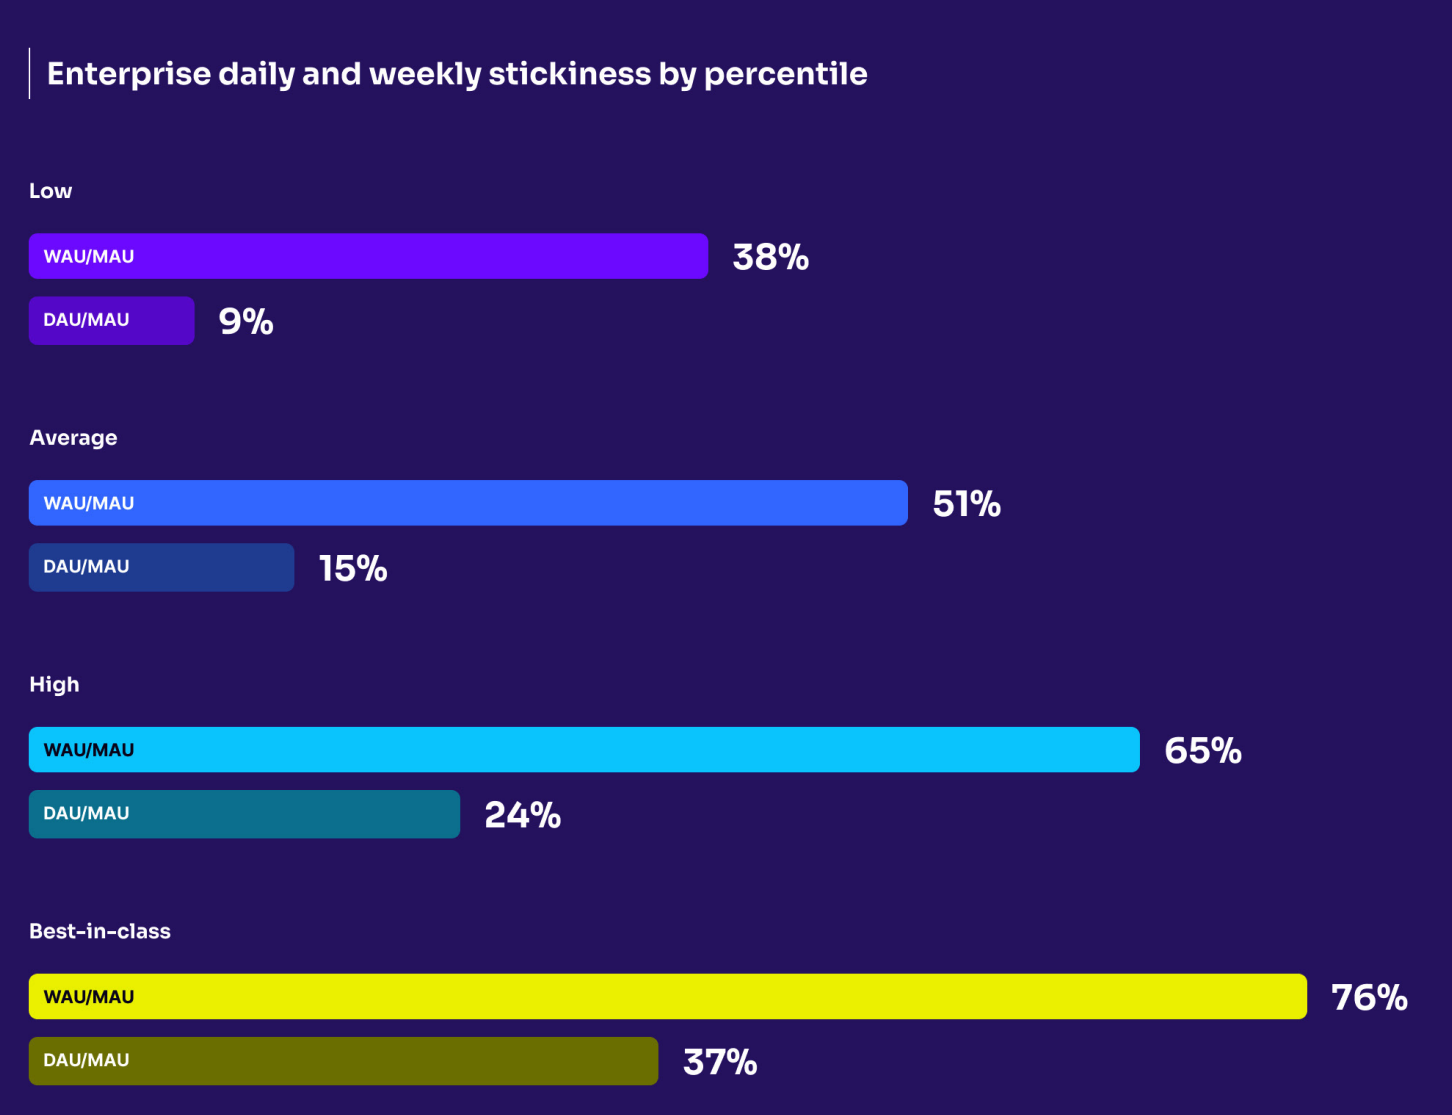
平均して、ユーザーの51%が1か月のうち少なくとも1週間はプロダクトと関わり、15%が24時間に少なくとも1回はプロダクトと関わります。つまり、ユーザーの半数以上がエンタープライズプロダクトに価値があると感じ、永続的な習慣を身につけているということになります。
上位10%のプロダクトでは粘着性が毎月1.5倍に
For best-in-class enterprises, weekly stickiness jumps to 76% and daily stickiness is 37%. That means more than ¾ of users will log in on any given week, and 37 out of 100 users will log in on any given day.
プロダクトの粘着性を高める方法
- Encourage engagement: Your teams should add features and communications that encourage regular product interactions. These can include in-app notifications, emails, and other triggers.
- Promote the behaviors of engaged users: PMs should use product analytics to discover common behaviors among their most engaged users. Then, they can encourage other users to adopt those same behaviors with in-app guides.
- Understand what’s causing drop-offs: Watch visual data of your least and most sticky users to understand their behaviors. From there, PMs can use in-app guides and walkthroughs to help build habits and uncover value.
- Use in-app guides to speed up the time to “aha!” moments: The faster your teams can add value to your users, the more likely they are to return.
This is just a taste of the benchmarks your enterprise’s product team can (and should) track. Explore our interactive software benchmarks tool to drill into your performance by industry and region.
*2024年Mind the Product Benchmarks Reportの定量データは、2023年5月1日から2024年3月30日までのPendoの顧客サンプルの集計および匿名化されたプロダクトデータの分析によるものです。匿名データの共有をオプトアウトしたPendoのお客様はこの分析から除外されています。
![[object Object]](https://cdn.builder.io/api/v1/image/assets%2F6a96e08774184353b3aa88032e406411%2F39f3ccde352b460cbf348ccc952054cd?format=webp)