This is part of a series of posts on the impact of the COVID-19 crisis on software product usage across 40+ industries and sub-industries, based on an analysis of anonymized product usage data across Pendo customers. Pendo updates the data weekly, with fresh analysis on emerging trends.
I’d like to thank Alex Rosenbower on our data science team for partnering on this analysis and building these visualizations.
As cities reopen and people slowly return to their social lives, some of the largest shifts in software product usage this month are happening within physical industries.
While usage of restaurant platforms is still down 49%, that’s up from an 85% drop in April. Travel software product usage is still down 33%, but up from a low of -63% in early April. Banking software usage has trended above our March 1 benchmark consistently, but jumped to 29% over the last week.
A small uptick in accelerating software usage across Pendo customers are reflective of these trends. While 93% of Pendo customers have seen product usage normalize, 5% are experiencing significant increases. And just 3% are seeing usage slow or decline—the smallest percentage since we started tracking in March. (See growth definitions here.)
Impact of COVID-19 on hospitality product usage growth
With positive press around the safety procedures put in place by some airlines, people appear to be flying again. At the same time, companies like Vrbo and Airbnb are reporting increased business as people hit the road for vacation and opt for a vacation rental. Those trends may help account for steady increases in travel and hospitality product usage over the last several weeks.
Restaurant product usage still lags behind the other hospitality categories, though, it is increasing. We’ll watch the data closely as reports predict anywhere from 20 to 75 percent of restaurants may close permanently as a result of the COVID crisis—others are looking to software platforms to help make their businesses efficient and profitable. For a deeper dive into software trends in that industry, check out the webinar we’re hosting June 23 with Toast.
Average weekly product usage change
In these visualizations of software usage across 14 key industries, note many more industries seeing higher product usage than when we started this analysis on March 1. Even for those industries in our negative trend chart, usage has begun to increase.
In particular, we’re seeing small but steady upticks in sports software product usage, likely a symbol of league and activity planning for the fall season. Health care usage is nearing a normal level after dropping 38% in April.
Event platforms remain depressed as people steer clear of large gatherings. No real changes in this category—usage has stayed consistently 54-55% down. And education usage has dropped into the negative for the first time since the crisis began. The reason is pretty clear—schools, both physical and virtual, are closed for summer.
製造
Manufacturing wasn’t part of our original analysis, but is worth calling out as part of this look at physical industries. Product usage has increased a bit since hitting a low of -33% in April, but remains about 22% lower than
pre-COVID levels.
GovTech
Usage of GovTech platforms, which manage aspects of city life, is still down by 12% but has climbed significantly after aggregate usage dropped 35% in April.
Retail/e-commerce
And we’ll round out this analysis with another look at our shopping charts. Though retail and point-of-sale platform usage ticked up a bit at the end of May, both categories remain at near record lows since March 1. E-commerce, meanwhile, remains on the upswing as many consumers continue to avoid bricks-and-mortar retail.
調査手法
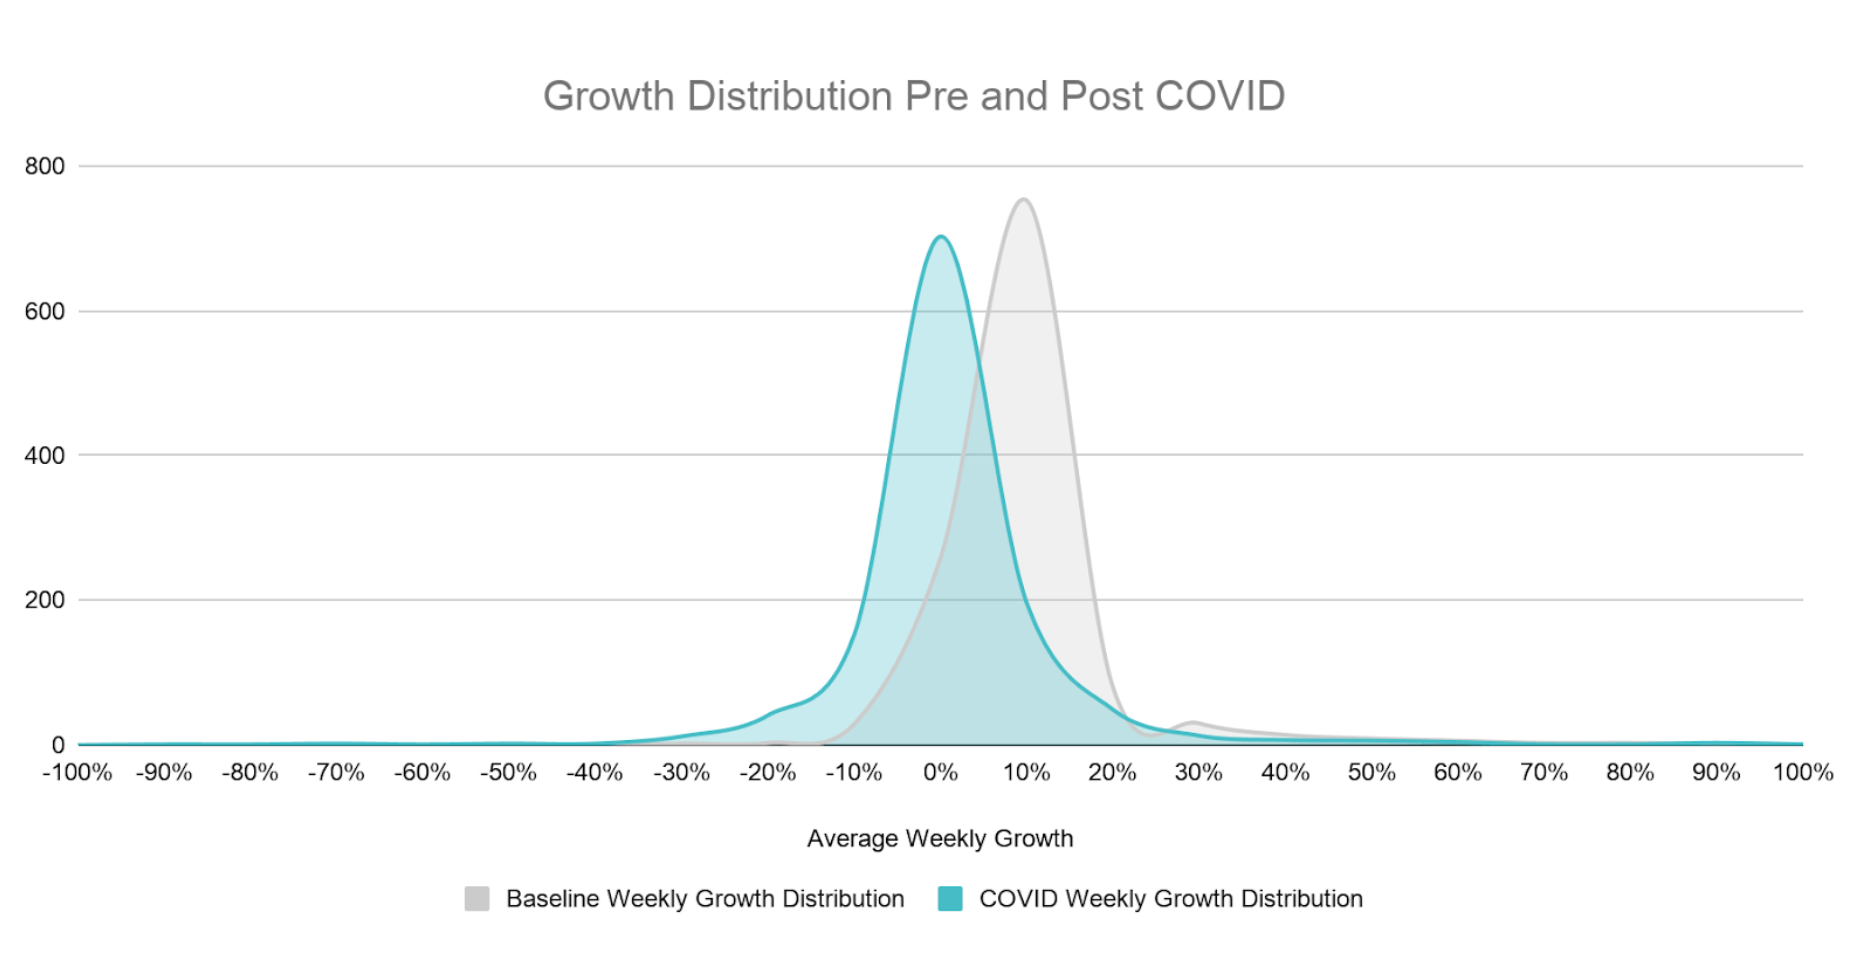
We gathered anonymized product usage data from a subset of Pendo customers and analyzed their average weekly growth during business days in the five weeks prior to the “COVID period” (2/3/20 – 3/6/20) to establish a baseline distribution of growth. We then updated average weekly growth during the COVID-19 period plotted against the baseline period. Products included in the analysis fall in one of the 40 industries, have at least 90 days of usage data and more than 10,000 average weekly events leading up to the COVID period to eliminate any outliers.
Growth category descriptions
The baseline average weekly growth of the customers fitting the criteria above is unweighted and represented in the gray distribution in the chart below. The standard deviation of growth during the baseline period was 12%. The distribution of growth during the COVID period is represented in the blue distribution and plotted along side the baseline period. The COVID period distribution is shifted to the left indicating slower growth during this period, overall.
Using the baseline distribution of growth, we established the following categories for how product usage has been impacted during the COVID period.
| カテゴリー | Description | Significance |
|---|---|---|
| Accelerating | Average growth during the COVID Period accelerating more than 15% | > 1.5 std dev above |
| Limited Impact | Average growth during the COVID Period was between -6% and 15% | +/- 1 std dev |
| Slowing | Average growth during the COVID Period decelerated between -7% and -12% | between 1 and 1.5 std dev below |
| Declining | Average growth during the COVID Period decelerated below -12% | > 1.5 std dev below |