This blog post is part of a broader series analyzing the impact the COVID-19 crisis is having on software product usage across 40+ industries and sub-industries. For additional insights and analysis from our data science team, check out our previous posts in the series: 75% of software companies see minimal change to product usage during COVID-19 crisis and Shipping software usage jumps 54%, e-commerce software usage climbs 18% during COVID-19 crisis
In this post, we’ve included up-to-date charts for more than a dozen industries to track how software usage compares to pre-COVID-19 baselines. The first two charts show which industries are seeing a positive or a negative impact in terms of product usage, and the charts below demonstrate how software usage is performing across a handful of key industries we’re monitoring closely.
These charts are updated weekly so readers can visualize the impact of the ongoing crisis.
Average weekly product usage change
If you’d like to see fewer items on this chart, click on the ones you’d like to hide above
If you’d like to see fewer items on this chart, click on the ones you’d like to hide above
ヘルスケア
If you’d like to see fewer items on this chart, click on the ones you’d like to hide above
Hospitality
If you’d like to see fewer items on this chart, click on the ones you’d like to hide above
Human Resources
If you’d like to see fewer items on this chart, click on the ones you’d like to hide above
Shipping and Retail
If you’d like to see fewer items on this chart, click on the ones you’d like to hide above
Real estate
If you’d like to see fewer items on this chart, click on the ones you’d like to hide above
マーケティング
If you’d like to see fewer items on this chart, click on the ones you’d like to hide above
Finance
If you’d like to see fewer items on this chart, click on the ones you’d like to hide above
教育
If you’d like to see fewer items on this chart, click on the ones you’d like to hide above
調査手法
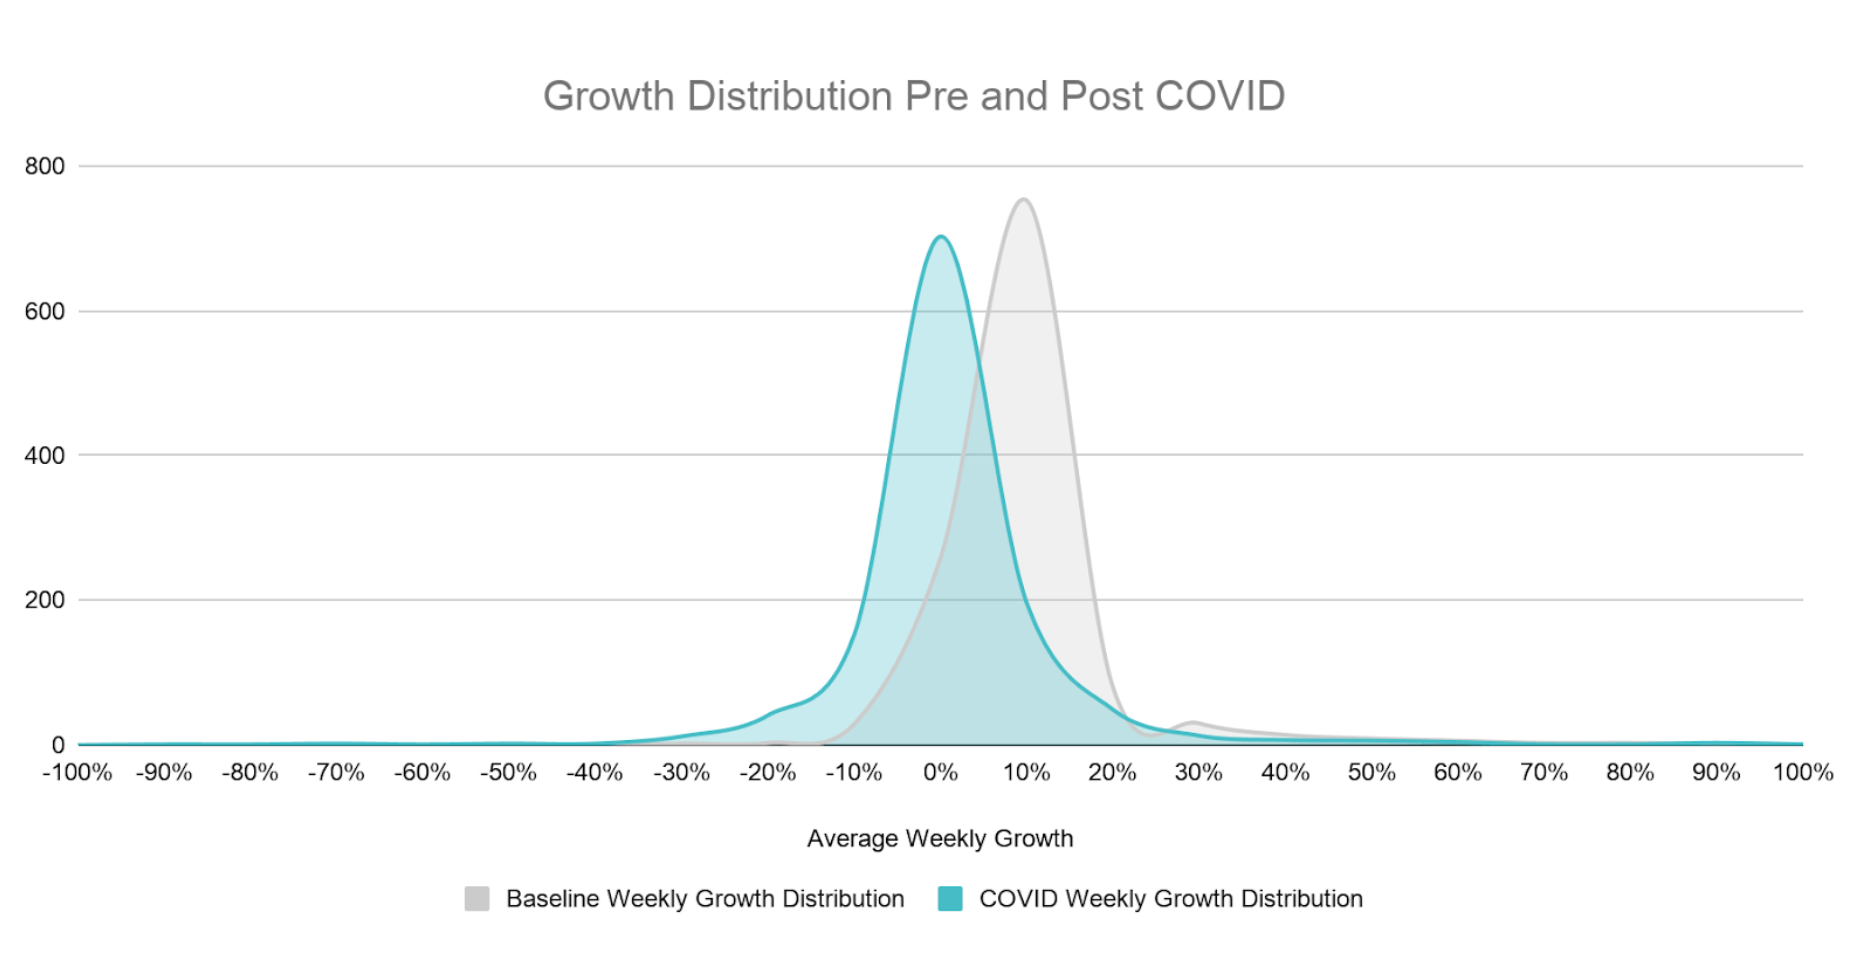
We gathered anonymized product usage data from a subset of Pendo customers and analyzed their average weekly growth during business days in the five weeks prior to the “COVID period” (2/3/20 – 3/6/20) to establish a baseline distribution of growth. We then updated average weekly growth during the COVID-19 period plotted against the baseline period. Products included in the analysis fall in one of the 40 industries, have at least 90 days of usage data and more than 10,000 average weekly events leading up to the COVID period to eliminate any outliers.
Growth category descriptions
The baseline average weekly growth of the customers fitting the criteria above is unweighted and represented in the gray distribution in the chart below. The standard deviation of growth during the baseline period was 12%. The distribution of growth during the COVID period is represented in the blue distribution and plotted along side the baseline period. The COVID period distribution is shifted to the left indicating slower growth during this period, overall.
Using the baseline distribution of growth, we established the following categories for how product usage has been impacted during the COVID period.
| カテゴリー | Description | Significance |
|---|---|---|
| Accelerating | Average growth during the COVID Period accelerating more than 15% | > 1.5 std dev above |
| Limited Impact | Average growth during the COVID Period was between -6% and 15% | +/- 1 std dev |
| Slowing | Average growth during the COVID Period decelerated between -7% and -12% | between 1 and 1.5 std dev below |
| Declining | Average growth during the COVID Period decelerated below -12% | > 1.5 std dev below |