Shipping software usage jumps 54%, e-commerce software usage climbs 18% during COVID-19 crisis
This is the second in a series of posts on the impact of the COVID-19 crisis on software product usage across 40+ industries and sub-industries, based on an analysis of anonymized product usage data across Pendo customers. Pendo will update the data weekly, with fresh analysis on emerging trends.
I’d like to thank Alex Rosenbower on our data science team for partnering on this analysis and building these visualizations.
A couple stats in the media stuck out to me as I compiled this week’s report.
The first, a projection by Forrester that global retail sales will fall 9.6% in 2020, with non-grocery sales dropping 20%.
The second: by 2024, online grocery sales will more than double, and a third of non-grocery spending will happen online. To put that in perspective, online shopping made up 16% of retail sales in the U.S. in 2019.
We’re already seeing these trends reflected in our weekly analysis of product usage data.
While most software products are seeing usage normalize since stay-at-home orders began in March, shipping software usage climbed 54% above the March 1 baseline, up from 41% last week, and e-commerce software usage rose from 9% to 18%. Check out the trend lines, and additional analysis, below.
Impact of COVID-19 crisis on product usage growth
Software product usage continues to normalize in week two of our analysis of the impact of COVID-19, with 82% of software products seeing usage return to normal levels, up from 75% last week.
Fewer companies are seeing drastic declines or even slowing product usage—14% are slowing or declining, down from 19% last week. 4% of products continue to accelerate—e-learning software leads the pack, with usage up 167% since March 1. (See definitions of these categories here.)
If you’d like to see fewer items on this chart, click on the ones you’d like to hide above
Average weekly product usage change
In the charts below, we’ve provided a visualization of software usage across 14 key industries—grouped by positive and negative trend lines. And in six most-impacted categories, we’ve provided a deeper dive into sub-industries seeing significant usage gains and losses.
If you’d like to see fewer items on this chart, click on the ones you’d like to hide above
If you’d like to see fewer items on this chart, click on the ones you’d like to hide above
Shipping and Retail
Key finding: As stated above, rises in usage of shipping and e-commerce software correlate with trends we’re seeing in online shopping. But drops in usage of logistics and supply chain software, as well as retail technologies like point-of-sale platforms show that e-commerce growth fails to make up for the massive drop in bricks-and-mortar shopping.
If you’d like to see fewer items on this chart, click on the ones you’d like to hide above
Real estate
Key finding: Our analysis of real estate software shows 12% lower usage overall, with construction software impacted least even with halts to non-essential projects in some states over the last few weeks. After a large dip in usage of real estate software in early April, last week’s climb is a good reminder that we’re still in the spring buying season. Any long-term impacts to these sectors seem TBD.
If you’d like to see fewer items on this chart, click on the ones you’d like to hide above
マーケティング
Key finding: This marketing product usage chart proves how difficult it can be to classify usage for an entire industry—while brand marketing platforms are seeing usage rise, advertising platforms have suffered, with usage dropping up to 44%. These data points make sense—companies are more likely to double down on brand and content plays and conserve cash they may have spent on advertising.
If you’d like to see fewer items on this chart, click on the ones you’d like to hide above
Finance
Key finding: We spotlighted the finance industry last week because of large usage spikes that mapped to the U.S. government stimulus and PPP loan programs. Usage of most finance-related platforms has returned to a normal range this week, with insurance software usage still in decline.
If you’d like to see fewer items on this chart, click on the ones you’d like to hide above
教育
Key finding: And another nod to e-learning, which saw record usage last week and continues to outpace every category in our study.
If you’d like to see fewer items on this chart, click on the ones you’d like to hide above
調査手法
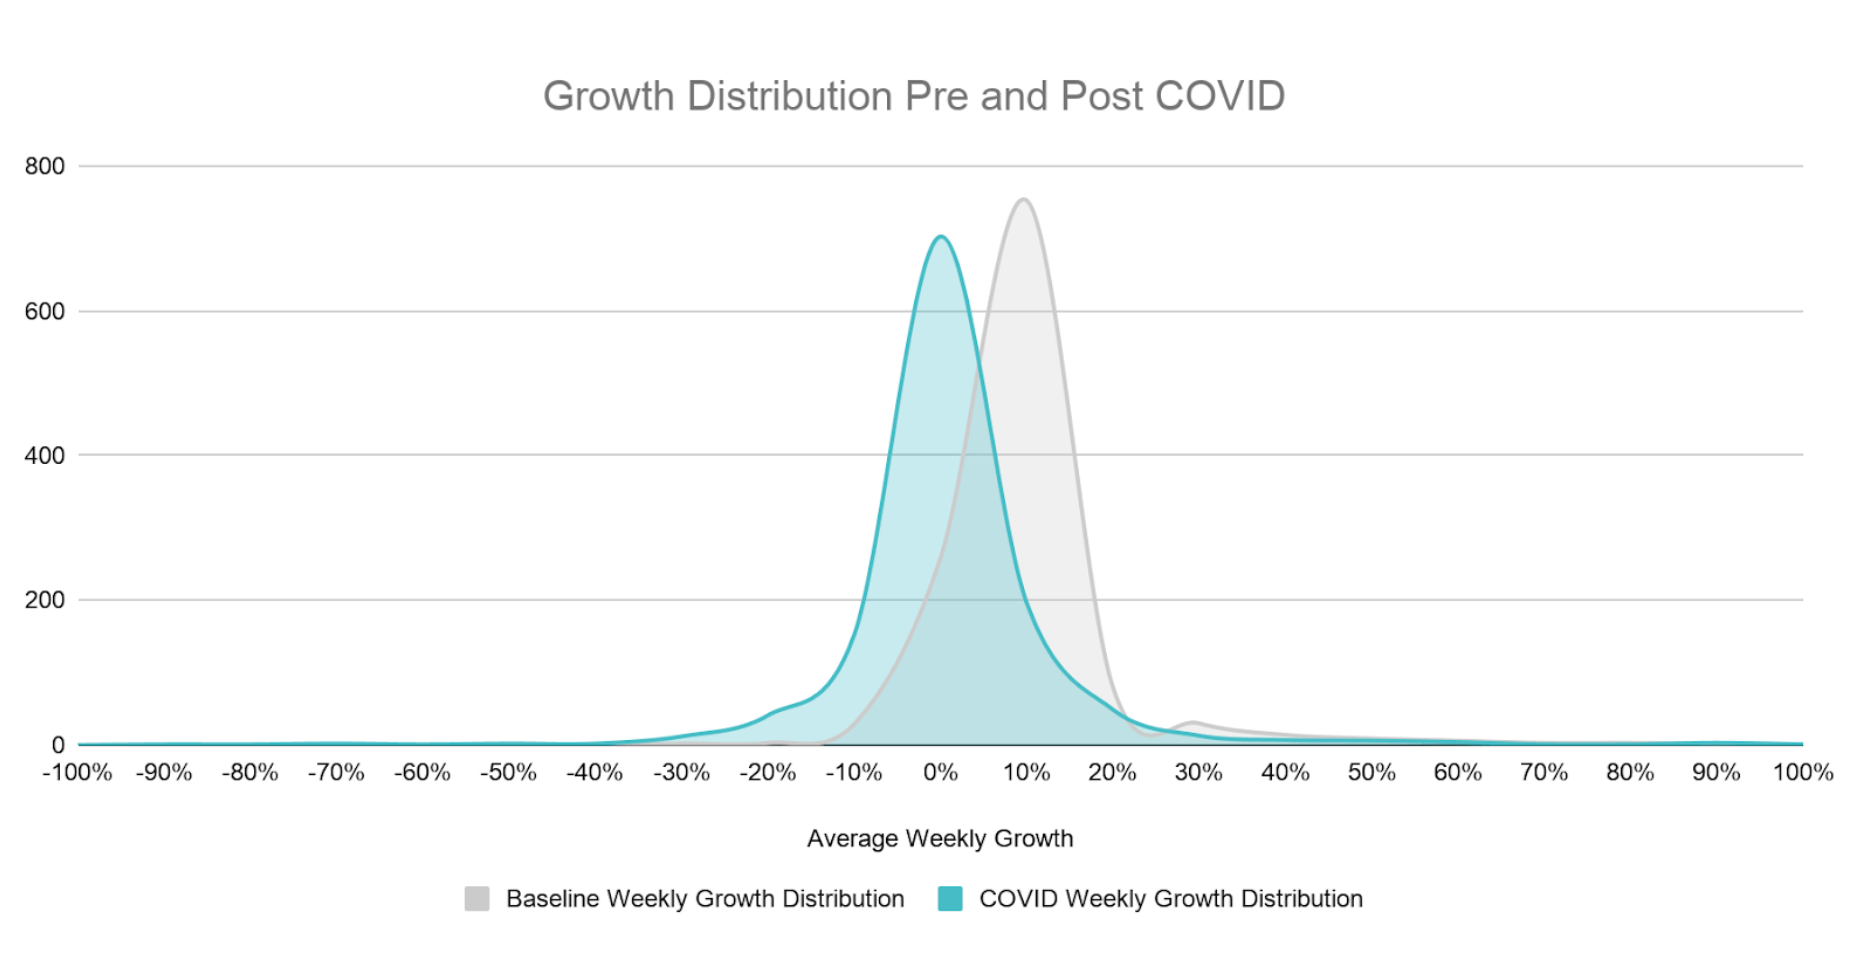
We gathered anonymized product usage data from a subset of Pendo customers and analyzed their average weekly growth during business days in the five weeks prior to the “COVID period” (2/3/20 – 3/6/20) to establish a baseline distribution of growth. We then updated average weekly growth during the COVID-19 period plotted against the baseline period. Products included in the analysis fall in one of the 40 industries, have at least 90 days of usage data and more than 10,000 average weekly events leading up to the COVID period to eliminate any outliers.
Growth category descriptions
The baseline average weekly growth of the customers fitting the criteria above is unweighted and represented in the gray distribution in the chart below. The standard deviation of growth during the baseline period was 12%. The distribution of growth during the COVID period is represented in the blue distribution and plotted along side the baseline period. The COVID period distribution is shifted to the left indicating slower growth during this period, overall.
Using the baseline distribution of growth, we established the following categories for how product usage has been impacted during the COVID period.
| カテゴリー | Description | Significance |
|---|---|---|
| Accelerating | Average growth during the COVID Period accelerating more than 15% | > 1.5 std dev above |
| Limited Impact | Average growth during the COVID Period was between -6% and 15% | +/- 1 std dev |
| Slowing | Average growth during the COVID Period decelerated between -7% and -12% | between 1 and 1.5 std dev below |
| Declining | Average growth during the COVID Period decelerated below -12% | > 1.5 std dev below |