Centralizing data to fuel customer centricity
Foregroundの概要

カスタマーインサイト担当ディレクター
Foreground
Foregroundは、家族や個人を世界クラスの写真家と結びつけるプロダクトプラットフォームを提供しています。Eコマース、教育、生産性向上ソリューションからコラージュや印刷ツールに至るまで、同社は写真家や写真愛好家が一生の思い出を作れるよう支援しています。
課題
In the past, providing Foreground’s product team with data to improve decision making required a hefty dose of manual work. With data scattered in multiple places and slide decks and spreadsheets needing to be created or updated each month, the company was seeking a better solution.
Pendoの使い方(Pendo'ing it)
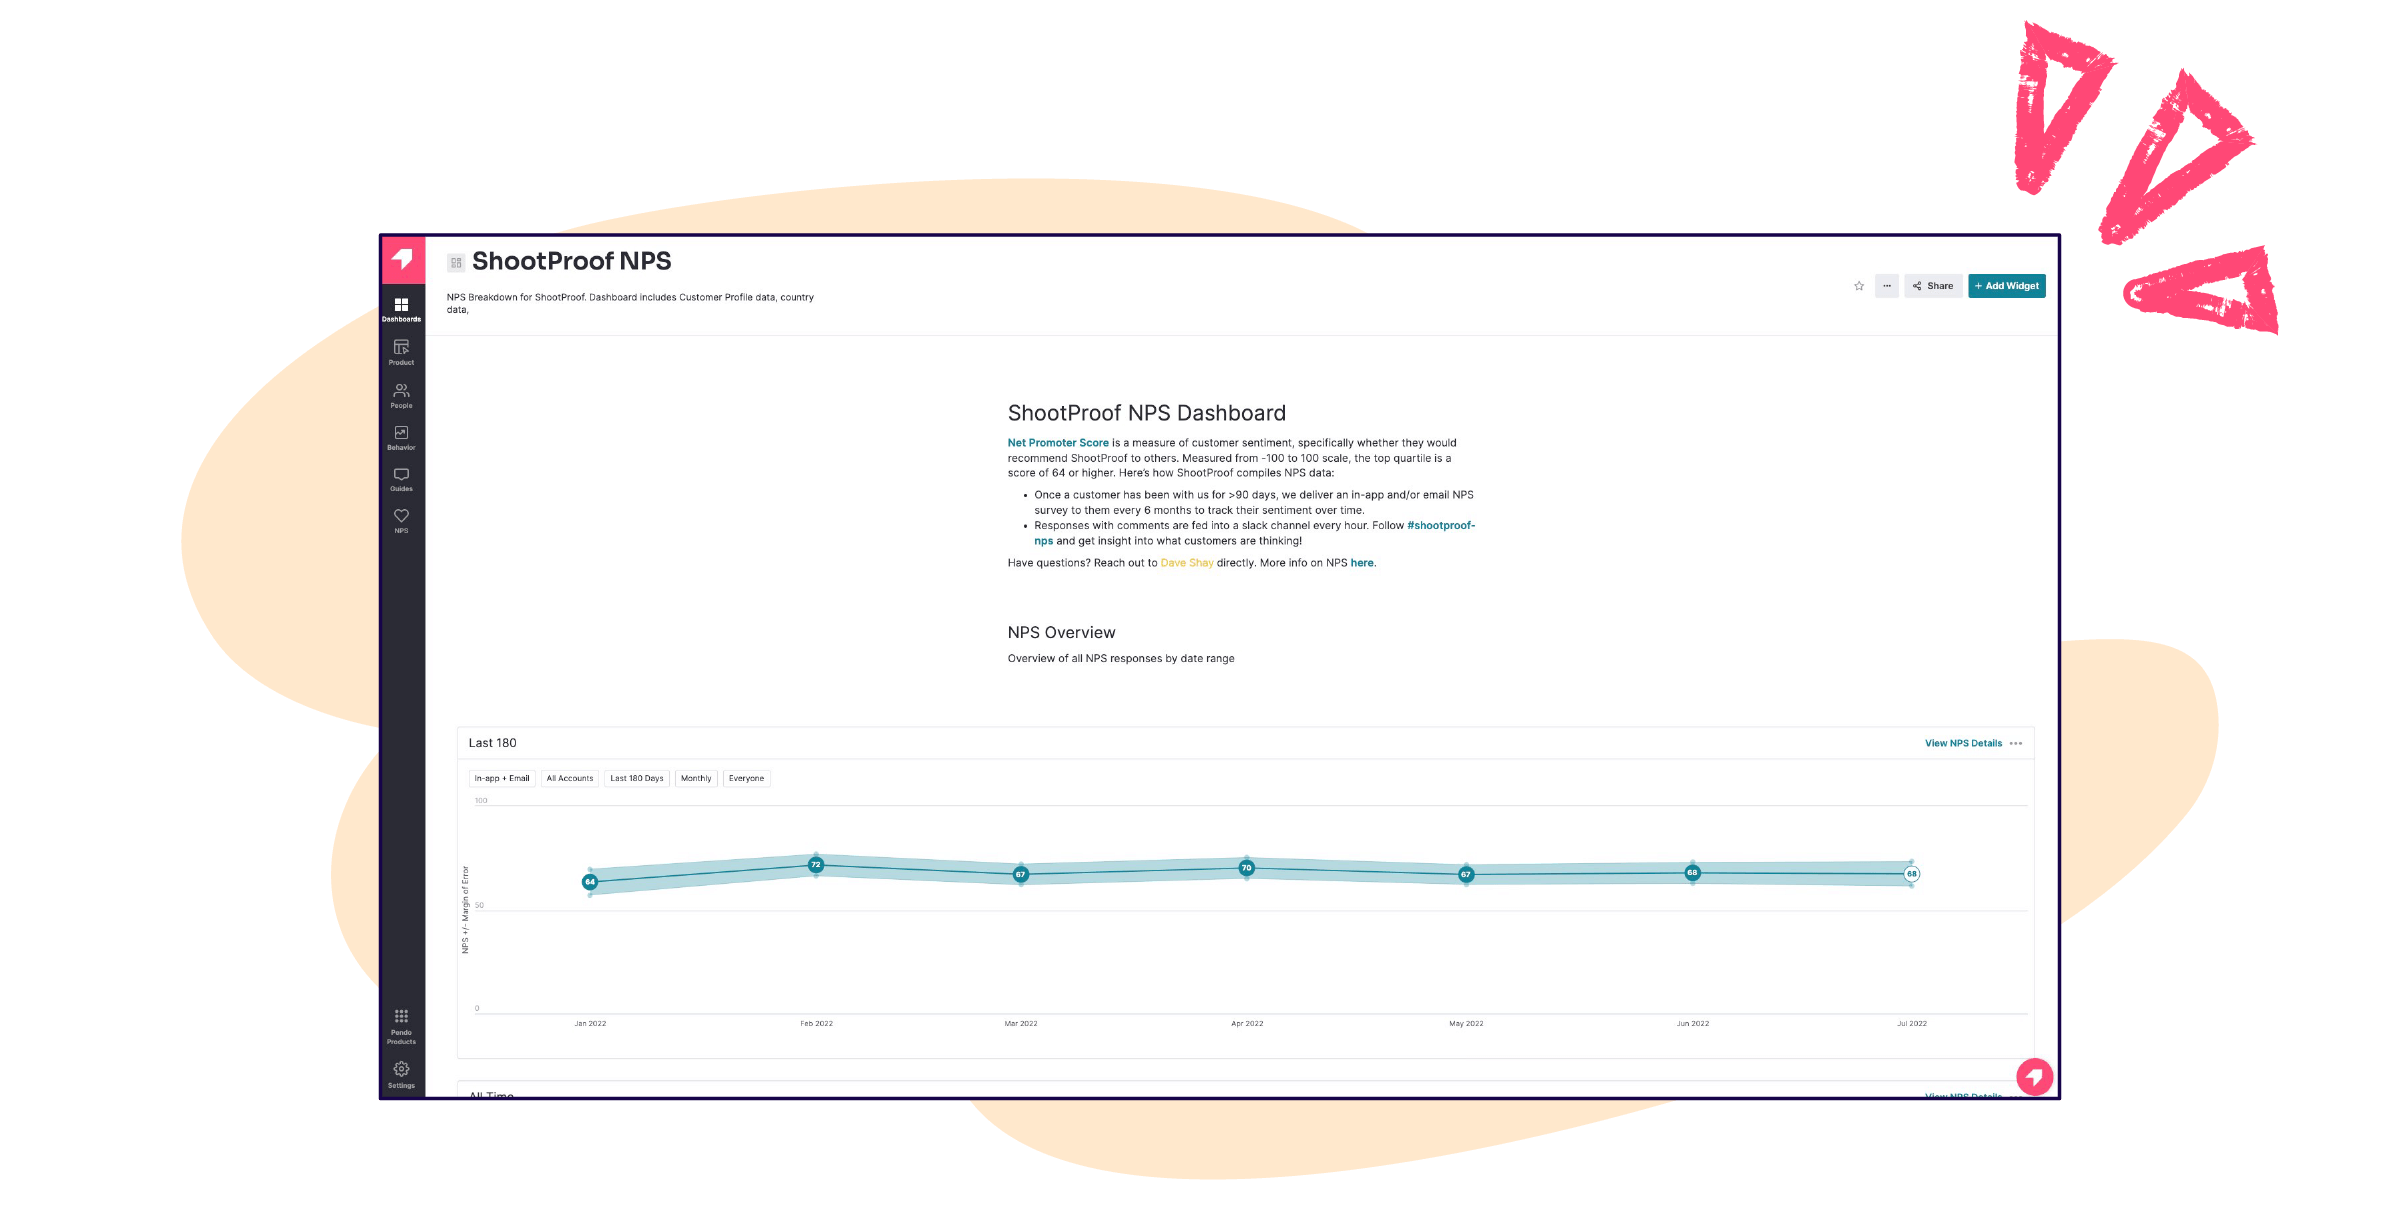
With Pendo, Foreground is able to bring all of their relevant data—including quantitative and qualitative, high-level and in-the-weeds—into dashboards that are centralized, shareable, and scalable.
結果
Pendoダッシュボードは、複数のデータポイントを1か所にまとめ、チームメンバーがセルフサービスで作業できるようにするだけでなく、プロダクト組織全体の好奇心を刺激しました。これらのインサイトを活用することで、チームはプロダクトの使用データとフィードバックに基づいて継続的に反復し、進化する顧客のニーズにより適切に対応できるようになります。
目次
Pendoダッシュボードが当社にもたらした効果を一つ挙げるとすれば、組織全体の好奇心を刺激してくれたことです。
Dave Shay氏、カスタマーインサイト担当ディレクター、Foreground
手動による分散型から、拡張性のある集中型へ
プロダクト使用状況の測定、アンケートの実施、機能リクエストの収集、ネットプロモータースコア(NPS)や顧客満足度(CSAT)の追跡など、企業はこれまで以上に多くの方法で顧客との距離を縮めることができます。とはいえ難しいのは、組織全体の関係者がこのデータにアクセスでき、あらゆるフェーズで顧客体験を向上させるために効果的に活用できるようにすることです。Pendoは、このプロセスをシームレスかつスケーラブルにするのに役立ちます。
As the director of customer insights at Foreground, a platform that connects families and individuals with photographers, Dave Shay is focused on providing a holistic data set that the product team can use to inform decisions and improve their work. “My hope is to empower [the product team] with as much data as I can so that when they’re designing new functionality and moving the product forward, they’re doing so in a way that’s really focused on customers’ needs,” Shay explained.
過去には、データが複数の場所に分散していたため、スライドデッキやスプレッドシートを毎月作成または更新する必要があり、かなりの手作業が必要でした。最初のステップとして、Shay氏はこれらのデータをすべてPendoに取り込み、一元化された単一のホームとすることに注力しました。「私の仕事の中核となる部分は、特定のプロダクト、ローンチ、または施策に関するデータを求めて人々がアクセスできる中心的な場所を確保することです。そのためにPendoダッシュボードは非常に重要です」と同氏は言います。
Where numbers and stories collide
データを集中化することの利点は、Foregroundが顧客向けに新しい決済ゲートウェイをリリースした際に特に有用であることが証明されました。プロダクトチームはオンボーディング、利用開始支援とアプリ内エンゲージメントの低下に気づき始めたため、Shay氏は新規ユーザーから情報を収集し、エンゲージメント戦略を強化するためのアプリ内ガイドを作成しました。「誰かが初めてログインすると、すぐにガイドが表示され、新しいアカウントにサインアップしたときに表示される質問が表示されました」と同氏。「私たちはすぐにユーザーについて学び始めることができ、初めてペルソナ間の違いを大規模に把握することができました。」
その後、Shay氏は収集したプロフィール情報をPendoダッシュボードに追加し、社内の誰もが過去7日間、30日間、90日間のデータを簡単に閲覧できるようにしました。さらに重要なのは、これらのインサイトを活用して戦略を立てることができることです。「例えば、昨年7月に当社のプラットフォームを利用するファミリー写真家がオーガニックに増加したことが分かれば、今年はそのグループをターゲットにしてマーケティングを微調整することができます」と同氏は説明します。Shay氏はダッシュボードに「訪問者ごとのフィーチャー使用」ウィジェットも追加し、チームメンバーはさまざまなユーザーセグメントでどの機能が使用されているかを確認できるようになりました。特定のセグメントの使用状況がおかしいと思われる場合、チームは詳しく調査し、アプリ内アンケートを作成して、ユーザーが特定の場所で行き詰まっている理由を把握することができます。
After sharing the dashboard with his team, one of the first things Shay noticed was the types of questions he started getting. “They started asking all sorts of questions that they’ve never asked before,” he said. “To me, that was a sign of success.” This also helped shape Shay’s strategy for building dashboards. Now, he’ll create a dashboard, share it, and then spend the next two to three weeks adding to the dashboard based on the questions he gets asked. “If I were to say what Pendo Dashboards have given us the ability to do, it’s to empower curiosity throughout our organization,” said Shay.

In addition to bringing multiple data points into one place and enabling team members to self-serve, Pendo Dashboards have also helped Foreground stay laser-focused on their customers. For Shay and team, what’s most useful about dashboards is that they can present “the numbers and the stories” right next to each other. “If I launch a feature and see ‘X’ number of people use it, that’s great,” said Shay. “But if I can also see results from the survey users receive after using the feature for the first time, that’s where I learn if the feature is truly delivering value. Seeing survey responses right next to usage data really helps hold our team accountable.”
Shay also noted how pre-dashboards, each team member looked at every piece of data through their own lens. Now, by including multiple data points together—quantitative and qualitative, high-level and in-the-weeds—it’s easier to keep everyone grounded to the holistic data set within the dashboard itself. As he put it, “This has really helped with alignment, because oftentimes in organizations, you have people who are very detailed thinkers and you have people who are more big picture thinkers. Some people love their quantitative data, and some love their qualitative data—but getting everyone access to all of those data points together is what really makes an impact.”
The final benefit Shay highlighted is the ability to better meet customers’ changing needs. “We’ve been able to be flexible because we understand our customers better with the knowledge we’re pulling out of Pendo,” he said. “Two months from now we might see that the industry shifts again. And I like to think that we will know about it before our competitors, because we are constantly paying attention to our customers this way. It puts our customers at the center.”
プロのヒント
- If you’re not sure where to start with dashboards, choose one initiative—like a feature launch—and create a dashboard for it, then build from there
- Make sure you’re representing quantitative and qualitative data on every dashboard, even if you’re only able to link out to things like survey responses or results
- Stay curious when looking at or building a dashboard in Pendo—try not to come in with assumptions that you’re hoping to validate