目次
In a rush? Download the PDF for later
Download the 電子書籍最適化されたソフトウェア体験を通じてITチームがビジネスをサポートする方法
はじめに:岐路に立つデジタルワークプレイス
ソフトウェアは職場の一部から職場そのものへと進化しました。これは、従業員の連携や業務の進行方法だけでなく、ITリーダーが戦略やビジネス目標と照らして職場のソフトウェア体験をどう捉えるかにも大きな影響を与えます。
Consider just one element of the evolving software landscape: the accelerating addition of Generative AI (GenAI) tools into workflows and applications. This technology is transformative, but comes with a price tag. A recent Gartner report found that software vendors are expected to increase prices 30% annually as they embed AI into SaaS and other solutions. With that expected price increase comes the expectation that software will add that much more value.
It’s more important than ever for companies to invest in digital transformation and bring together IT and business objectives. According to a McKinsey survey, 73% of top performing companies now say that their CIOs and senior IT leaders are heavily involved in shaping company strategy. With that shaping and planning comes the need to measure and build accountability around shared KPIs. But which are the most important ones for building effective employee software experiences?
Right now, many companies are working to strengthen software experiences in three key ways: reducing risk, cutting costs, and increasing revenue. The problem? Too many companies are executing on these initiatives in silos leading to inefficiencies and lack of a holistic strategy to improve the digital workplace. In reality, effective employee software experiences sit at the intersection of these three pillars.
これらの主要領域ごとの進捗、また領域をまたいだ進捗は、どのように測定すべきでしょうか?ここでは、すべてのITチームと運用チームが追跡すべき10個のKPIと、ITでの取り組みを最適化し生産性を向上させるためのヒントを紹介します。

収益を増加させるためのKPI
1. ワークフローの生産性
In order to boost productivity, organizations have to decide how best to measure it and arrive at a baseline off of which to set future goals. Workflow productivity is the amount of time it takes for employees to complete business-critical workflows. What constitutes a business-critical workflow varies by context—it can be either a one-time or infrequent workflow (e.g. security trainings, performance reviews) or a recurring workflow (e.g. processing loan applications). The operations team’s focus should generally be on improving the latter because of their frequency and impact on things like revenue attainment and customer satisfaction.
さらに、ワークフローの完了時間は、生産性の指標であると同時に、プロセスの有効性を示す基準でもあります。プロセスがユーザーの業務を妨げていませんか?サービス提供の遅れで顧客体験を損ねていませんか?AIツールを導入することで従業員のパフォーマンスに有意義な影響を与えることができる分野ですか?人手をAIエージェントに置き換える余地は?こうした観点から、ワークフローの生産性を見直します。

ワークフローの生産性を改善する方法
Once you have a workflow productivity baseline, leverage analytics from a digital adoption platform (DAP) to see the flow of work across apps and across time. It may be that for certain workflows, employees are taking longer to finish because they’re getting stuck at a given point or encountering friction in some way that could be solved with better support. If there’s a particular form field that employees are confused about, for example, consider deploying an in-app notification to give them context and guidance on what the field is for and how to complete it in the desired way.
2. プロセスの定着率
プロセスの定着率とは、どれだけのユーザーがビジネスに不可欠なワークフローを完了しているかを示すアクティベーション指標です。重要な業務の多くは単一のアプリ内ではなく複数のアプリにまたがって行われるため、運用チームは、チームがどのようにプラットフォームを横断して業務を進めているか、またユーザーがコンプライアンスに沿って正しい方法でプロセスを完了しているかを把握することが重要です。ビジネスプロセスの有効性に注力する運用チームや他部門は、DAPが提供する強力な分析機能とAI生成のインサイトを活用して、アプリ間の業務の流れを把握し、従業員が実際にワークフローを完了しているかを特定できます。ワークフローが反復的か単発かによって、各チームが定着率をどう解釈し評価するかは異なります。
total # of users
プロセスの定着率データに対して起こすべきアクション
プロセスの定着率が低い、または定着化が遅いワークフローの場合:従業員が重要なワークフローを完了していなかったり、完了に苦労していることに気づいたら、まず、アナリティクスを使ってそのユーザーについてできる限り多くを知ることに注力すべきです。どのようなパターンが見えますか?これらの従業員には、共通の行動やメタデータがありますか(例:初めて行うプロセスなのか、同じオフィスで働いているのか、同じ役職なのか、など)?ワークフロー内で、ユーザーが離脱したり、摩擦が発生している特定のポイントはありますか?このようなインサイトを得ることで、チームはプロセスを最適化し、アプリ内およびアプリ間で従業員に適切なガイダンスとサポートを提供し、望ましい方法でワークフローを完了できるようにすることができます。

プロセスの定着率が高いワークフローの場合:従業員がワークフローやプロセスを迅速かつ意図したとおりに完了できている場合、運用チームが最もすべきことは「介入しないこと」です。これらの従業員はスーパーユーザーであり、AIエージェントを含む他のユーザーが同様の成果を上げられるよう、参考事例として活用できます。アナリティクスを活用してスーパーユーザーの特徴を把握し、そのインサイトをもとに、共通ワークフローの調整やアプリ内ガイドに反映させましょう。さらに、こうしたユーザーへの介入を控えることで、運用チームは不要な対応やメンテナンスを削減し、業務をよりスケーラブルに展開できます。
プロセスの定着率がいかにビジネスの成果につながるか
A leading home improvement retail business wanted to help its employees drive more revenue in its B2B wing, selling supplies to independent workers and contractors. To further this goal, the company launched a lead generation process within its homegrown customer relationship management (CRM) software that helped employees find professionals with upcoming jobs and projects. It launched a trial in which it used Pendo In-app Guides to drive adoption of this lead generation process at 100 stores. The company found that stores using in-app guides had adoption rates 2.5x higher than those that only used traditional means of driving awareness (e.g. email). It also found that the test group of stores increased monthly revenue by an average of $1.5 million more than the control group.
3. アプリケーションの定着率
アプリケーションの定着率は、特定のアプリケーションまたはツールを使用しているユーザーの数を測定する指標です。多くの場合、定着率は、月別アクティブユーザー数(MAU)、週別アクティブユーザー数(WAU)、日別アクティブユーザー数(DAU)を使って時系列で報告されます。特定のアプリとのエンゲージメントの程度と質を理解することで、ビジネステクノロジー部門は、そのアプリへの投資に対して妥当なROIが生み出されているかどうかを判断できます。
Businesses often only begin tracking and addressing application adoption once a digital transformation is well underway, but this is a mistake. According to McKinsey findings, the most successful CEOs “are as passionate about adoption as they are about strategy. They invest time up front in making sure that the people actually using the solutions…have a clear voice in the development process.”
なお、アプリケーションを使用する目的に基づいて、定着率の目標を設定することを忘れないようにしましょう。それは、ビジネスクリティカルな目的を果たすものですか?従業員が任意で使用する(オプトインする)ものですか?あるいは、人事情報を更新するなど、一年のうち特定の時期のみ使用するものですか?
/総ユーザー数
アプリケーションの定着率を改善する方法
デジタルツールやアプリの定着率が低いことに気付いた場合は、プロセスの定着化の場合と同様に、デジタルアダプションソリューションのアナリティクスを活用することができます。アプリの使用に苦労している特定のユーザー層がいるのか、それとも組織全体で定着率が低いのか?従業員はそのアプリを使うべきであるとそもそも認識しているのか?また、背景情報も考慮してください。単発のタスクやプロセス向けのアプリで、使用頻度が高くないものなのか?もしそうであれば、アプリの定着率が低いことは必ずしも問題ではないかもしれません。これらの質問の答えによっては、アプリ内のアラートとガイダンスによって定着率を向上させるための措置を講じたり、フィードバックを求めてアプリで従業員をサポートする最善の方法について理解を深めたりすることができます。
4. 投資収益率(ROI)
ITチームは常に、アプリケーションやデジタルプロジェクトの成功を、それがビジネスに与える価値によって測定する必要があります。そして、ITに資金を提供する担当者は、その価値を理解し、それに基づいて適切な投資収益率を決定する必要があります。ソフトウェアが優れた投資収益率(ROI)を生み出すには、そのソフトウェアにかけた費用よりも多くのお金を生み出すか、コストを節約するか、あるいは何らかの意味のある方法でリスクを軽減する必要があります。SaaS、AIツール全体のROIを測定する標準的な指標は多数あります。
One critical component of determining the ROI of software is time to value, or the amount of time from when an employee starts using an app to when the business begins deriving value from it. Another is license utilization rate, or the percentage of licenses a company has purchased for a given piece of software that is actually being utilized.
購入済みライセンス数
ROIデータに対して起こすべきアクション
価値実現までの時間が遅いユーザーに関しては、適切なオンボーディングとサポートの体験が得られているかどうかを確認してください。ユーザーへのオンボーディング戦略をどのように策定しているか?オンボーディングの過程を加速させることができるか?変更が頻繁で、疲労や混乱を招いていないか?トレーニングは直接行われていて、セッション終了後にハウツー情報やヒントにアクセスすることが困難か?それとも、チームが最も必要とするときにアプリ内で情報が適切に展開され、その後もリソースセンターでいつでもアクセスできるようになっているか?などを確認しましょう。
ライセンス使用率の低いソフトウェアの場合は、アナリティクスを使用して、ソフトウェアを使用していないユーザーを測定し、パターンや傾向があるかを確認します。部署や役職が同じか?同じ用途の別のソフトウェアに既に投資しているか?これらの質問に対する答えによっては、IT部門が支払っているライセンス数を減らし、予算を解放し、稼働中のソフトウェアのROIを向上させることができる可能性があります。
リスクを軽減するためのKPI
5. コンプライアンス率
ITチームにとって、コンプライアンスを推進し、従業員が主要な規制、プロトコル、ポリシーに沿った方法で作業できるようにするには、多くの作業が必要な場合があります。コンプライアンス率(ワークフローの完了などの特定のアクションがコンプライアンス要件にどの程度準拠しているか)を追跡することで、従業員がこれらの基準とベストプラクティスをどの程度遵守しているかを確認できます。高いコンプライアンス率を維持することは、高額な罰金や風評被害を伴う規制違反(GDPR、HIPAAなどのポリシーを想像してください)を回避するための鍵となります。コンプライアンスは、データのクリーン性、生産性、顧客の信頼を維持するためにも重要です。
完了したタスクの総数
コンプライアンス率を改善する方法
デジタルアダプションプラットフォーム(DAP)アナリティクスを使用して、コンプライアンス率を把握し、ビジネスを危険にさらす行動を特定します。優れたデジタルアダプションプラットフォーム(DAP)は、AIを活用して実用的なインサイトを可視化し、パターンを特定できます。たとえば、ある従業員グループ(職種や地域などに基づく)の方が、他のグループよりもコンプライアンスに苦戦していないでしょうか?その場合は、アプリ内ガイドを活用して該当する従業員にトレーニングや教育を行い、コンプライアンスに則った業務の遂行を促しましょう。対象を絞ったアプリ内サポートを使用すると、ガイダンスを必要とするユーザーには確実にガイダンスを提供し、必要のないユーザーには何もしないでおくことができます。
6. セキュリティインシデント
どの企業でも、どこかのタイミングで従業員を狙ったフィッシング攻撃、ビジネスシステムや機密データへの不正アクセス、元従業員や請負業者からの内部脅威など、何らかの形でセキュリティの脅威に直面することになります。種類に関わらず、企業は一定の期間(多くの場合は四半期ごとまたは1年ごと)におけるセキュリティインシデントの数を追跡し、時間の経過とともにその数を減らすよう努めることが重要です。
セキュリティインシデントを減らす方法
定期的なセキュリティ監査と従業員教育は、脅威を軽減するための鍵です。ほとんどの企業は、フィッシング攻撃のような脅威を見抜く方法を教えるセキュリティトレーニングを従業員に毎年義務付けていますが、従業員はこれらの単発のセッションをすぐに忘れてしまいます。また、脅威にさらされている間は、情報に容易にアクセスすることはできません。セキュリティの脅威に効果的に対抗するために、ITチームは、従業員にセキュリティのベストプラクティスを指導するアプリやワークフローの中で、常時サポートを提供する必要があります。行動に関する適切なインサイトがあれば、ITチームはデータへの不適切なアクセスやワークフローの誤った完了など、リスクのある行動パターンを特定し、下流でセキュリティインシデントが発生する可能性をより正確に評価できます。そこから、チームは脅威が発生する前に防ぐために、アプリ内でトレーニングとサポートを提供する追加の手順を実行することができます。
7. セグメント化されたアプリケーションネットプロモータースコア(NPS)
ネットプロモータースコア(NPS)は、企業が顧客満足度とロイヤルティを測る最も一般的な方法のひとつです。NPSは、「このブランドを友人や同僚に勧める可能性はどのくらいあるか?」という1つの質問に、顧客が0から10の数値で回答することで得られます。スコア9~10を「推奨者」、7~8を「中立者」、0~6を「批判者」として分類します。その後、推奨者の割合から批判者の割合を引いて算出された数値が、NPSになります。
Application Net Promoter Score works the same way as NPS, but it is delivered to employees for a workplace app or software (“How likely is it that you would recommend this product or application to a friend or colleague?”). It’s a metric that’s key to understanding the growing risk of shadow IT—after all, if employees don’t like using an application, they’re more likely to use unauthorized alternatives. Gartner predicts that by 2027, 75% of employees will acquire, modify, or create technology outside of IT’s visibility—up 41% from 2022.
セグメント化されたNPSでは、ビジネスシステム部門がスコアを評価する際に、個人またはチームがアプリケーションを使用する頻度を考慮します。たとえば、顧客関係管理(CRM)ツールに関するNPSスコアの場合、最も定期的かつ頻繁にアプリを使用する営業部門は、スコアが最も綿密に精査されるか、より重視されます。
セグメント化されたアプリケーションNPSデータに対して起こすべきアクション
NPSスコアを「頻度」というセグメントで調べます。たとえば、定着化を促進しようとする場合、使用頻度の低いユーザーのスコアを見ることで、より大きなエンゲージメントを妨げているものをより良く理解することができます。また高頻度ユーザーのスコアを調べて、そのツールがそのユーザーの生産性と士気に与える影響を最もよく理解することができます。スコアが特に低い場合は、その中の高頻度ユーザーをフォローアップして、満足度の低さの原因を把握します。そのツールは、チームの使用目的には適していないのか?AIツールやエージェント機能と統合することでメリットが得られるか?あるワークフローやプロセスにおいて、ツールや機能の使い方に混乱しているのではないか?このような疑問に対する答えを知ることは、ITチームが長期的にスコアを向上させるための介入策を計画するのに役立ちます。
すべての指標をセグメント化する必要はあるか?
アプリケーションNPSの場合、指標から真の価値を引き出すにはセグメントが必須です。アプリを最も頻繁に使用し、役割に不可欠な方法で使用している従業員は、提供するフィードバックの幅と深さが大きくなります。しかし、セグメントを活用することで、コンテキストに応じて他の指標をより意味のあるものにすることもできます。たとえば、アプリケーションや機能の定着化に関しては、役割やチームによるセグメント化が有効です。仮に、エンタープライズチームを対象としたセールスCRMアプリに追加された機能があるとします。その場合、定着率の健全性を評価する上で、市場別に定着率をセグメント化する(エンタープライズチームメンバーの定着率に重みづけする)ことは理にかなった方法です。
コスト削減のためのKPI
8. サポートへの問い合わせ数の減少
従業員に対して個別にサポートを提供する時間を減らすことは、常に重要な目標です。先見の明のあるチームは、デジタルアダプションプラットフォームを活用して、常に利用できる自動化されたサポートとガイダンスを提供することで、チームの行き詰まりを解消し、より早く稼働させることに成功しています。チームは、特定のアプリ、ツール、またはプロセスに関連する問い合わせチケットの量を基準として測定し、その数をアプリ内サポートリソースの展開後の一定期間後の量と比較することによって測定することができます。これらのソリューションは、さまざまなプロセスや機能に関するサポートとガイダンスを提供するヘルプセンターまたは情報がまとまったリソースハブの形で提供できます。また、アプリの中で、個人やチームに対して特定のタスクに関するAIを活用したトレーニングを行うという形でサポートすることもできます。
問い合わせ数のデータに対して起こすべきアクション
サポートへの問い合わせがあまり減っていないことに気付いたら、一歩下がって、アプリ内の介入を再評価してください。リソースセンターには、問い合わせてくる個人やチームを支援できる妥当な内容が含まれていますか?アプリ内のトレーニングやガイドをより分かりやすくすることはできますか?サポートは適切なユーザーを対象にしていますか?サポート内容が多すぎて必要なものが見つからないために、従業員が関心を示さなくなっていませんか?
サポート件数を減少させるとはどういうことか
When a top financial services enterprise wanted to lower the amount of support requests it was receiving from employees, it turned to Pendo on over 40 internal-facing applications to drive real results. Rather than wait passively for queries to come in, this company got ahead of things by leveraging the Pendo Resource Center to create sources of truth within apps around key processes, workflows, and best practices. It also utilized in-app guides to deflect “walk me through a process” and “educate me about X” type requests. The result was a staggering 60% decrease in support request volume, coupled with a 14x increase in Resource Center views. This led to greater productivity among branch employees, who were able to quickly self-serve and get back to customer interactions instead of waiting on the home office support center.
9. 総所有コスト(TCO)
どのようなソフトウェアにもコストがかかりますが、その多くは間接的なものであるため、ITチームやビジネスリーダーにとって、これらのコストが何であり、どのような金額であるかを正確に見極めるのは難しいことです。総所有コスト(TCO)は、あるソフトウェアに関わる直接的、間接的なコスト全体を考慮した指標です。つまり、ライセンス、サポート、エンジニアリング、オンボーディング、保守、AIなど、ソフトウェアの導入、稼働の維持、従業員への適切なアップデートと修正の優先順位付けに必要なすべての費用を意味します。チームがソフトウェアに関するTCOのベースラインを設定すれば、改善の機会を見出すことができます。
総所有コストに対して起こすべきアクション
総所有コストが高いソフトウェアの場合、ITチームがコストの内訳を理解して、具体的に何がそのアプリへの支出を増やしているかを確認し、それを削減するための措置を講じることができます。たとえば、あるアプリのライセンス更新コストは低いものの、メンテナンスやアップグレードにかかるコストが高い場合があります(アプリによっては、適切にアップデートするために追加のツールを必要とするものもあります)。どの要素がコストを押し上げているかを知ることは、IT部門がコストを削減するための適切な戦略を立てるのに役立ちます。

大手商業用不動産会社がワークプレイスアプリのTCOを削減した方法
10. ソフトウェアの無計画な増加
Perhaps no problem has plagued IT departments more in recent years than SaaS sprawl—the proliferation of apps in companies’ internal stacks. These apps come with major costs—costs only growing with the rise of AI. It’s imperative for companies to have the right-sized digital portfolio for their needs, and measuring portfolio sprawl helps IT teams gauge how far off they are from where they need to be. They may choose to measure sprawl several ways—in terms of the number of internal-facing apps overall or the number of apps per user, for example.

ソフトウェアの無計画な増加に対して起こすべきアクション
ポートフォリオの内容を正確かつ包括的に把握した後、ITチームとビジネスシステム部門のリーダーは、ソフトウェアと予算のニーズに合わせてポートフォリオの規模を調整する方向へと進めます。その方法の1つが、DAPアナリティクスを活用して、各アプリの使用状況を調べ、さらに投資する価値があるのか、そのままでいいのか、それとも廃止するべきかを判断する方法です。たとえば、多くの企業では、重複するアプリ(すでにポートフォリオにある他のアプリと同じ目的や同等の機能を提供するアプリ)に無駄な費用を支払っていることが多く、状況を把握できればその使用を停止できます。
職場ソフトウェア体験がもたらすビジネス成果
本書で紹介するKPIを測定することで、ITチームやオペレーションチームが意図を持ってソフトウェア体験を設計し、現在提供されているものを改善することができます。企業がその場しのぎの混沌とした体験から、スムーズなワークフロー、アプリ、プロセス、AI要素が連携する状態に移行すると、従業員とビジネス全体で大きなメリットが得られます。物事を前に進めるために、ある要素や別の要素を絶えず優先順位付けする時代は終わりました。
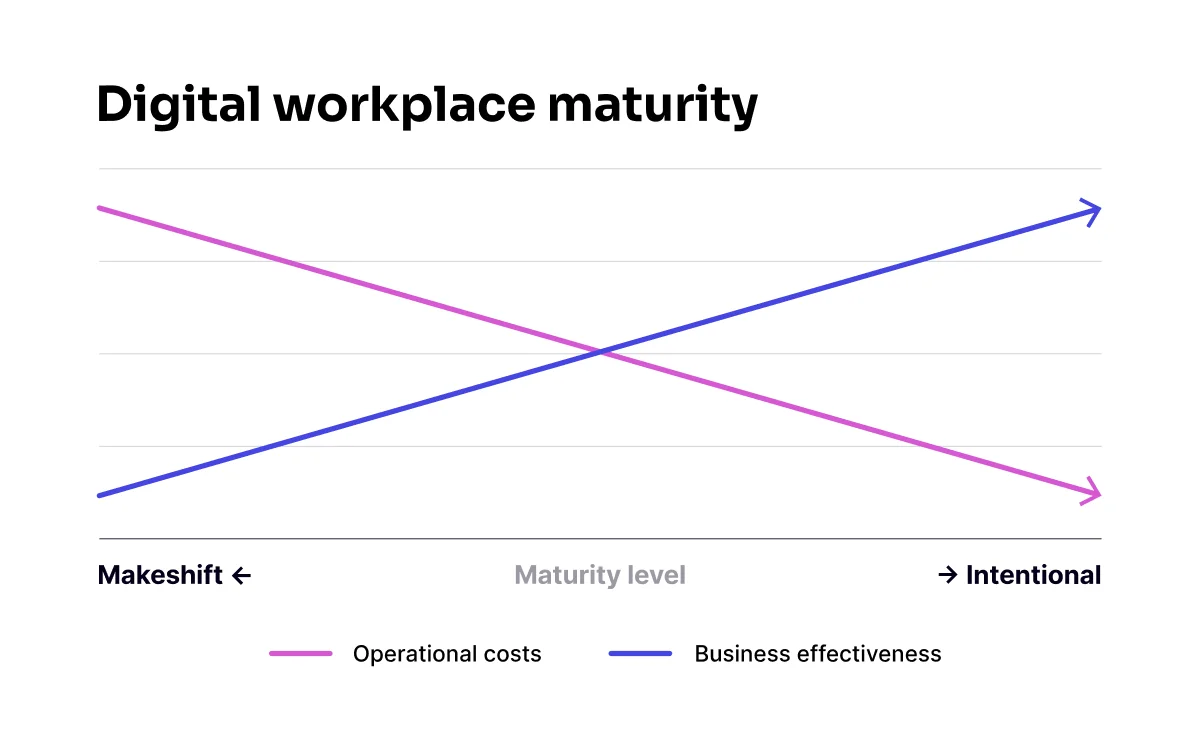
従業員に適切なソフトウェア体験を提供することで、運用コストとリスクが低下し、業務効率が向上し、企業と従業員の双方にとってより良い結果が得られるようになります。
今こそデジタルワークプレイスの改善を始める時です。ソフトウェアをよりスムーズで、スマートで、使いやすくする体験を構築しませんか?

