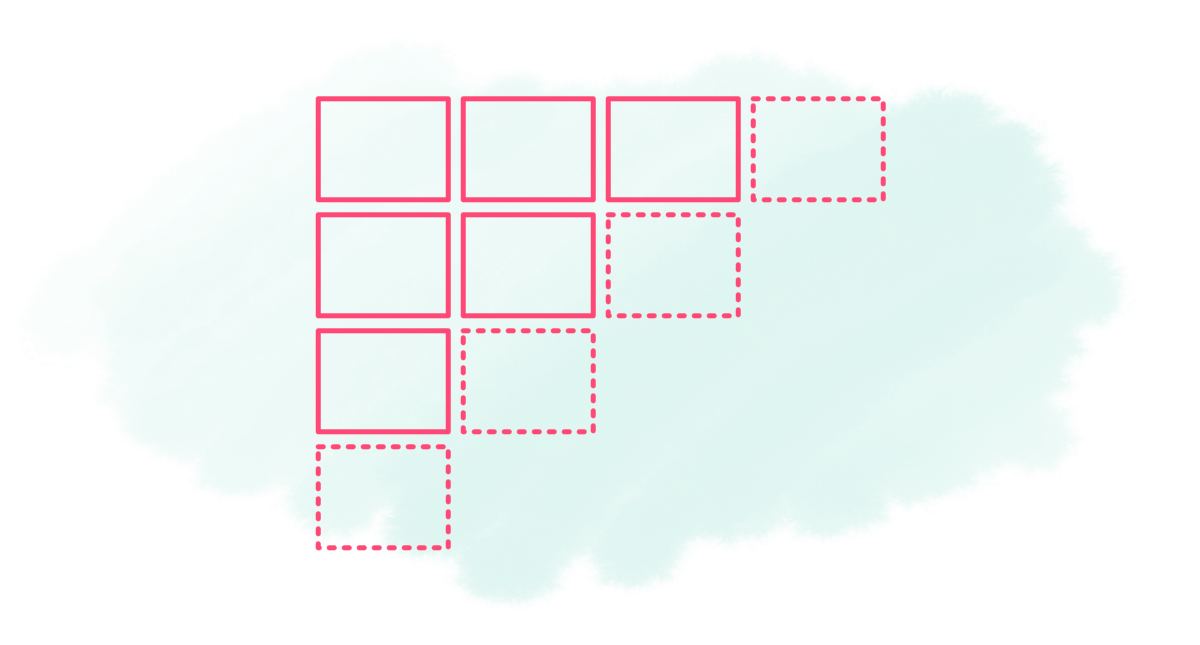
Statistics show that acquiring a new customer costs five times more than retaining an existing customer. It also shows that increasing customer retention by 5% can increase profits by 25–95%. This is why retention is one of the standard visualizations that a PM needs to rely on to understand how their product or a particular feature is performing over time.
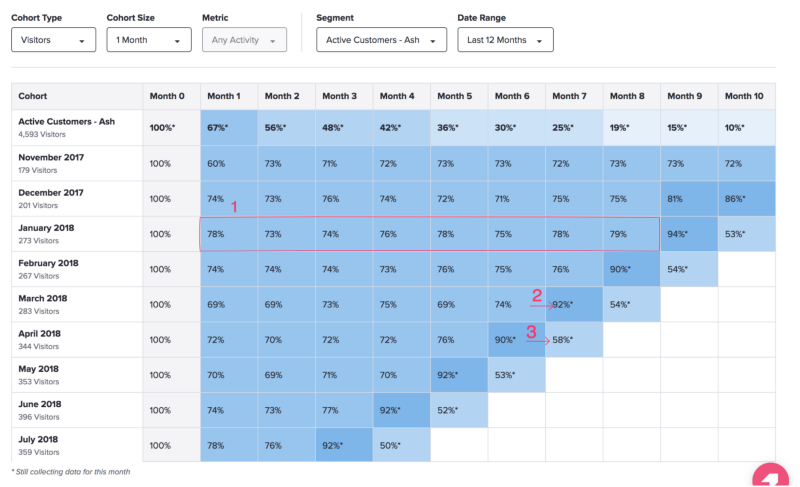
This visualization may look daunting at first, but when broken down can really help you understand the performance of your product. Some of the parts that you might see in a retention graph are:
1. Flatline
Take a look at any cohort and you will see that with time, the retention becomes stable. This means that your customers are finding constant value in your product. In other words, there is a “product market fit”. The main idea here would be to increase the overall percentage of retention. If you see that the retention is constantly decreasing, then your customers have not realized the value of your product. This means that you might want to start reaching out to them to understand their needs and also make them understand how your product can help them.
2. Spike
Usually, there will be a spike in retention when a new feature is released or a support ticket is resolved or marketing is done. Anything that helps the customers use your product more effectively or provides more value to them should increase your product retention.
3. Drop
Usually, after a spike, there will be a drop in retention. This is not unusual because the spike happened due to possible marketing efforts around the new feature release, which brought people back to the product. However, when you start to see the dip through the weeks, you might want to consider another release. Software companies often do quick, iterative feature improvements to ensure that the overall retention stays high.
Once you have understood the basics of the retention graph, you will be able to test any hypothesis that you may have formed. Pendo makes this really easy with its segment filter.
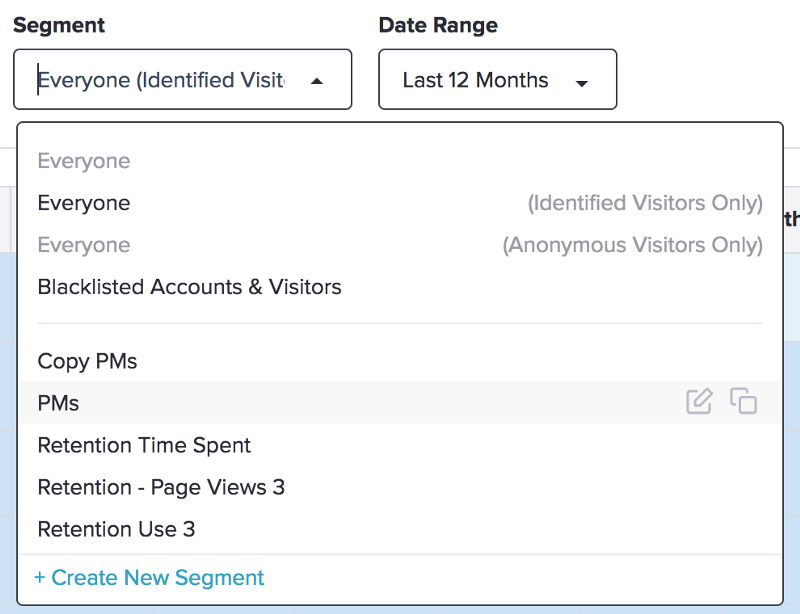
I used this for the first time when I saw the retention chart with the default visualization of all the visitors in our product. I instantly knew that all the visitors were not active and thus low retention might not be true. So, I created a segment to show the retention of the visitors who were active for at least five days in the last two months. Clearly, the retention was better.
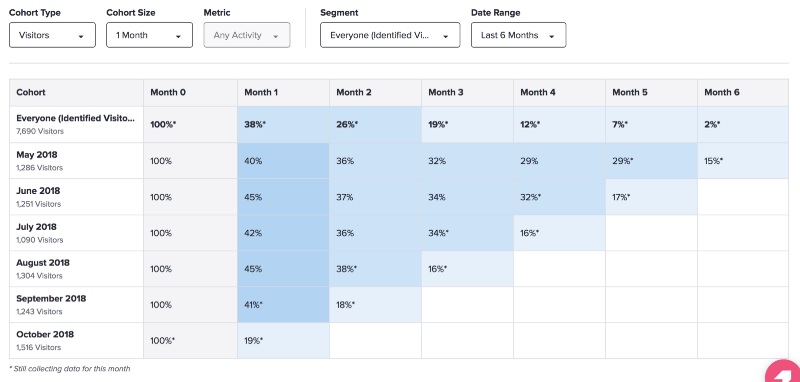
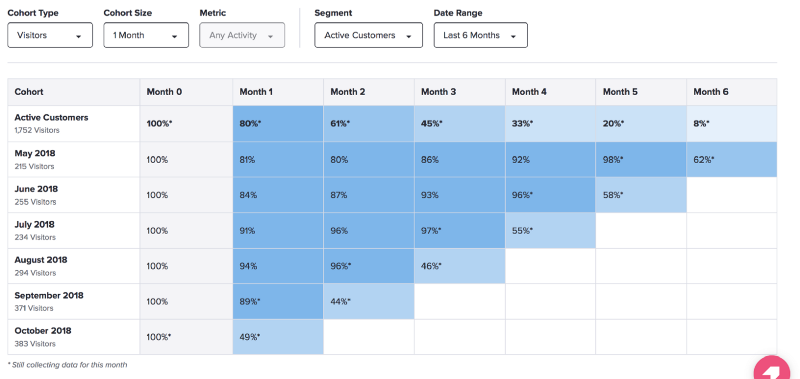
It also makes sense to do something similar if you have different tiers of users or want to see how the accounts that have high ARR are retaining.
You can also validate the value points in your product. At Pendo, one of our main value points is publishing a guide. If you compare accounts that have not published a guide to accounts that have published at least one guide, you can see the increase in retention.
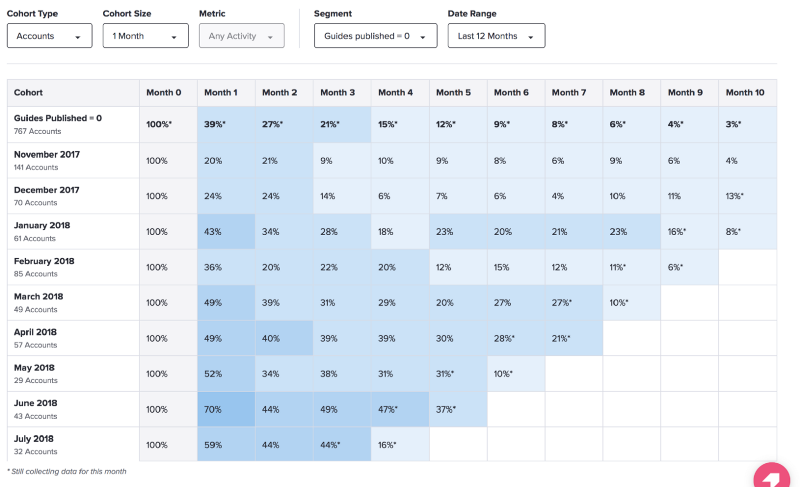
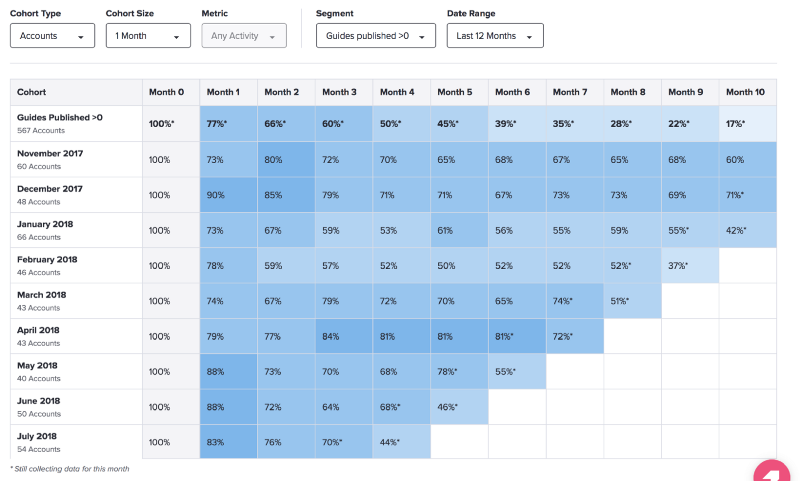
This difference clearly confirms that “publishing a guide” is a value point we want our customers to reach as soon as possible to make our product sticky.
In Pendo, clicking on any of the cells shows the list of visitors that are a part of the data of that cohort. This makes it really easy for me to reach out to the customers who form a part of the “best-performing cohorts”.
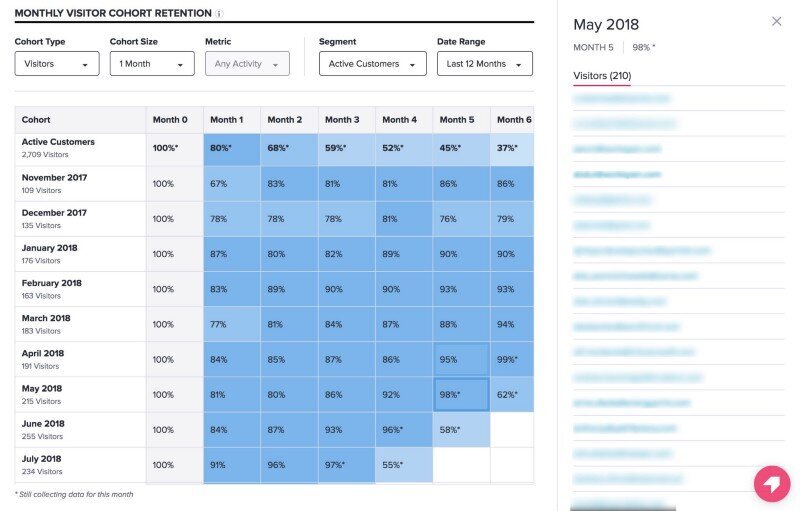
I use this feature a lot because my goal is to not only replicate the experience of the “best-performing cohort” (understanding their onboarding experience, their common characteristics and how they use Pendo) but also, to understand how they want the feature to evolve. Knowing the questions they are trying to answer with retention is how I prioritize my phase 2 feature enhancements. In fact, as soon as retention got released, one of the main requests we received was to introduce a “dropped visitors” list which would help our customers reach out to their visitors who are not using the product anymore. We started working on it because an immediate feature enhancement would not only help our customers but would also help us increase our retention.
These are just some of the ways in which I have been using retention till now. I cannot wait to improve the feature to answer more questions through constant customer feedback!
Thanks to Laura Baverman.
