(Last Updated: November 19, 2025)
“Growth at all costs” has been the mantra for startups and large businesses alike for many years, but this strategy is quickly waning. Now, companies must focus on growing efficiently. And one of the keys to efficient growth is retaining the customers you already have.
When it comes to customer health, teams need to shift from being reactive to proactive—which all starts with data. With a product analytics tool, you can easily see how often users return to your product and which features they engage with—two signals of whether or not they are getting value. If users aren't finding your product valuable, they're at risk of abandoning it altogether and, eventually, churning.
The key to effective churn prediction is understanding which metrics actually signal risk. While many teams track dozens of data points, three core signals consistently predict customer churn: engagement patterns, retention behavior, and feature adoption. When monitored together, these metrics give you the early warning system you need to intervene before customers leave.
ユーザーや顧客の健全性を把握するのに役立つPendoの指標を、いくつかご紹介します。
- Logins: See the number of logins across all users for a given account, over a given time period, e.g. within the last 30 days
- Active users: See the number of active users for a given account, over a given time period, e.g. within the last 30 days
- Days active, Time on site, and Usage trending: Pull these metrics into a report (at the visitor or account level) to quickly identify accounts that are trending towards risk
- Stickiness Widget: Track the ratio of average daily or weekly active users to average weekly or monthly active users, in a given time period
These metrics provide a solid foundation for monitoring customer health. However, tracking individual metrics in isolation can lead to false positives or missed signals. The most effective approach combines multiple data points to build a comprehensive view of churn risk.
In addition to consistently tracking usage metrics like those listed above, let's dig into three ways you can use Pendo to take a proactive approach to measuring—and improving—customer health.
1. プロダクトエンゲージメントスコア(PES)
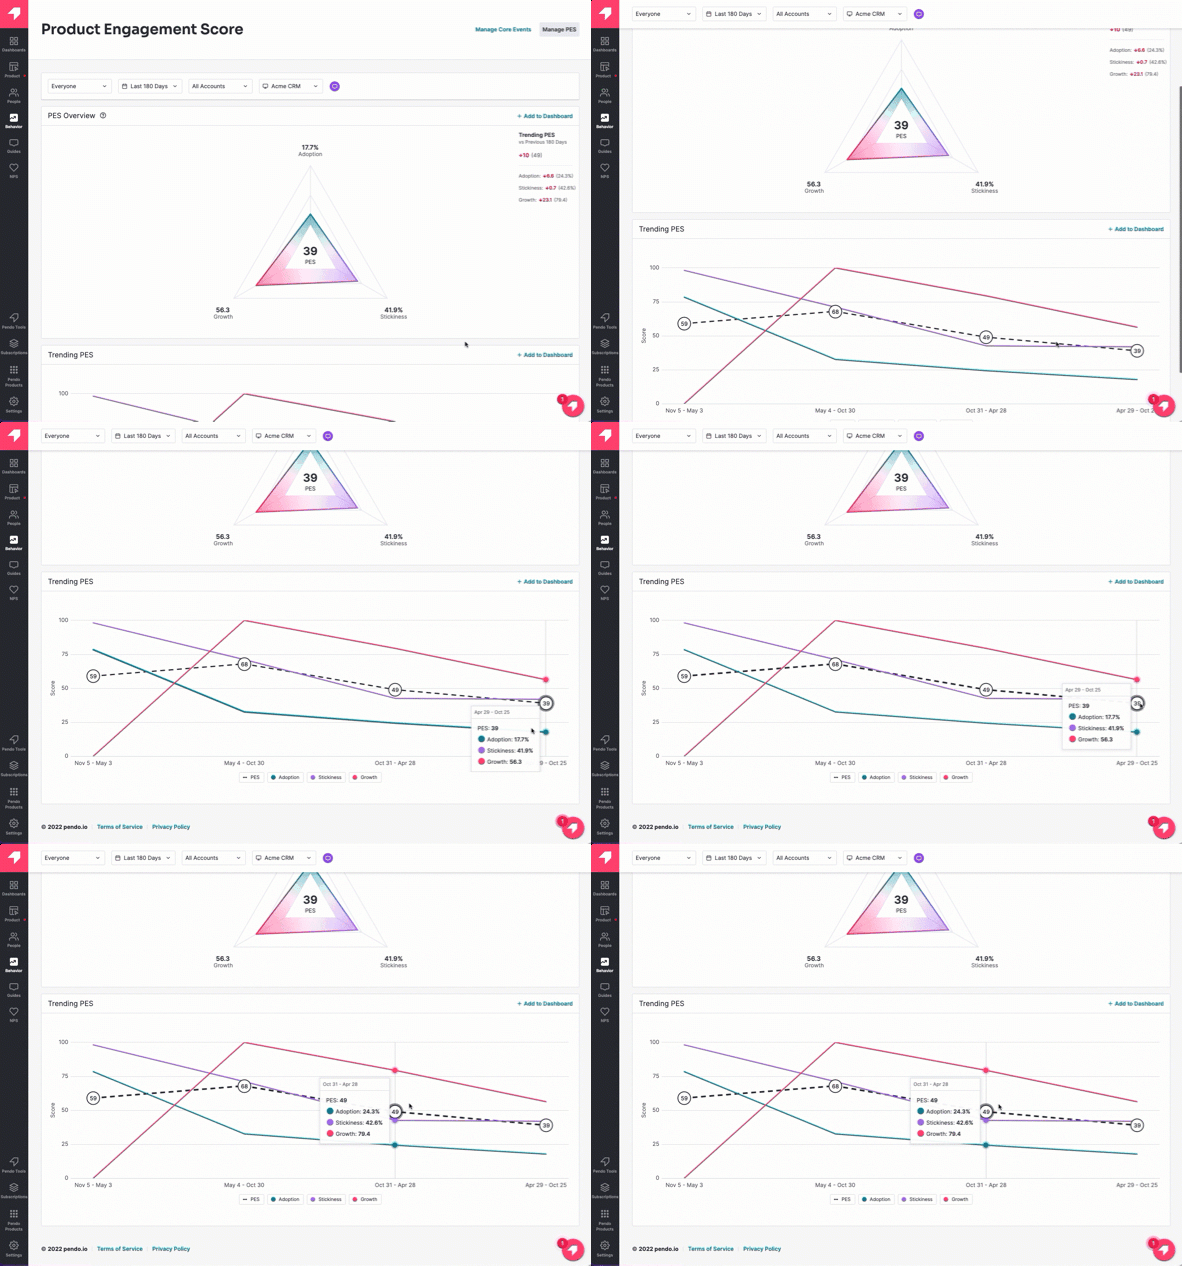
The Product Engagement Score (PES) is a composite metric in Pendo that allows you to measure user engagement with a single number. It’s made up of three components (adoption, stickiness, and growth), so teams can both understand engagement at a high level and dig into the individual metrics contributing to engagement.
In addition to continuously tracking PES and identifying opportunities to improve user engagement, you can also use it to predict—and prevent—churn. After analyzing Product Engagement Score and contract renewal data, Pendo’s data science team found that PES is correlated with customer retention. In the months leading up to a renewal decision, the accounts with the highest PES were the most likely to renew and expand, those with slightly lower PES were likely to renew flat, and those with the lowest PES correlated with churn.
Why PES works as a churn predictor:
Unlike sentiment metrics that capture how users feel at one moment, PES measures what users actually do over time. This behavioral data proves more reliable because engagement patterns tend to decline weeks or months before a customer decides to leave—giving you a critical intervention window.
これを理解していれば、プロダクトエンゲージメントスコアを顧客の健全性の先行指標として使用することができます。PESが減少している場合は、その3つの構成要素それぞれを掘り下げて、どの指標が平均を押し下げているのかを確認します。
From there, you can use Pendo’s in-app guides to drive positive user behaviors and demonstrate your product’s value. For example:
- アプリ内のウォークスルーやツールチップを作成し、プロダクトの最も重要な機能の発見と使用を促進する。
- プロダクトへのアクセス頻度が高いユーザーが使用する機能を特定する。次にアプリ内キャンペーンを実施し、他のユーザーをプロダクトのその領域に誘導する。
- Pendoのリソースセンター使用して、プロダクトのウォークスルーやヘルプセンターの記事、ドキュメントにユーザーがいつでもアクセス可能な常時オンのハブを作成する。
2. リテンション
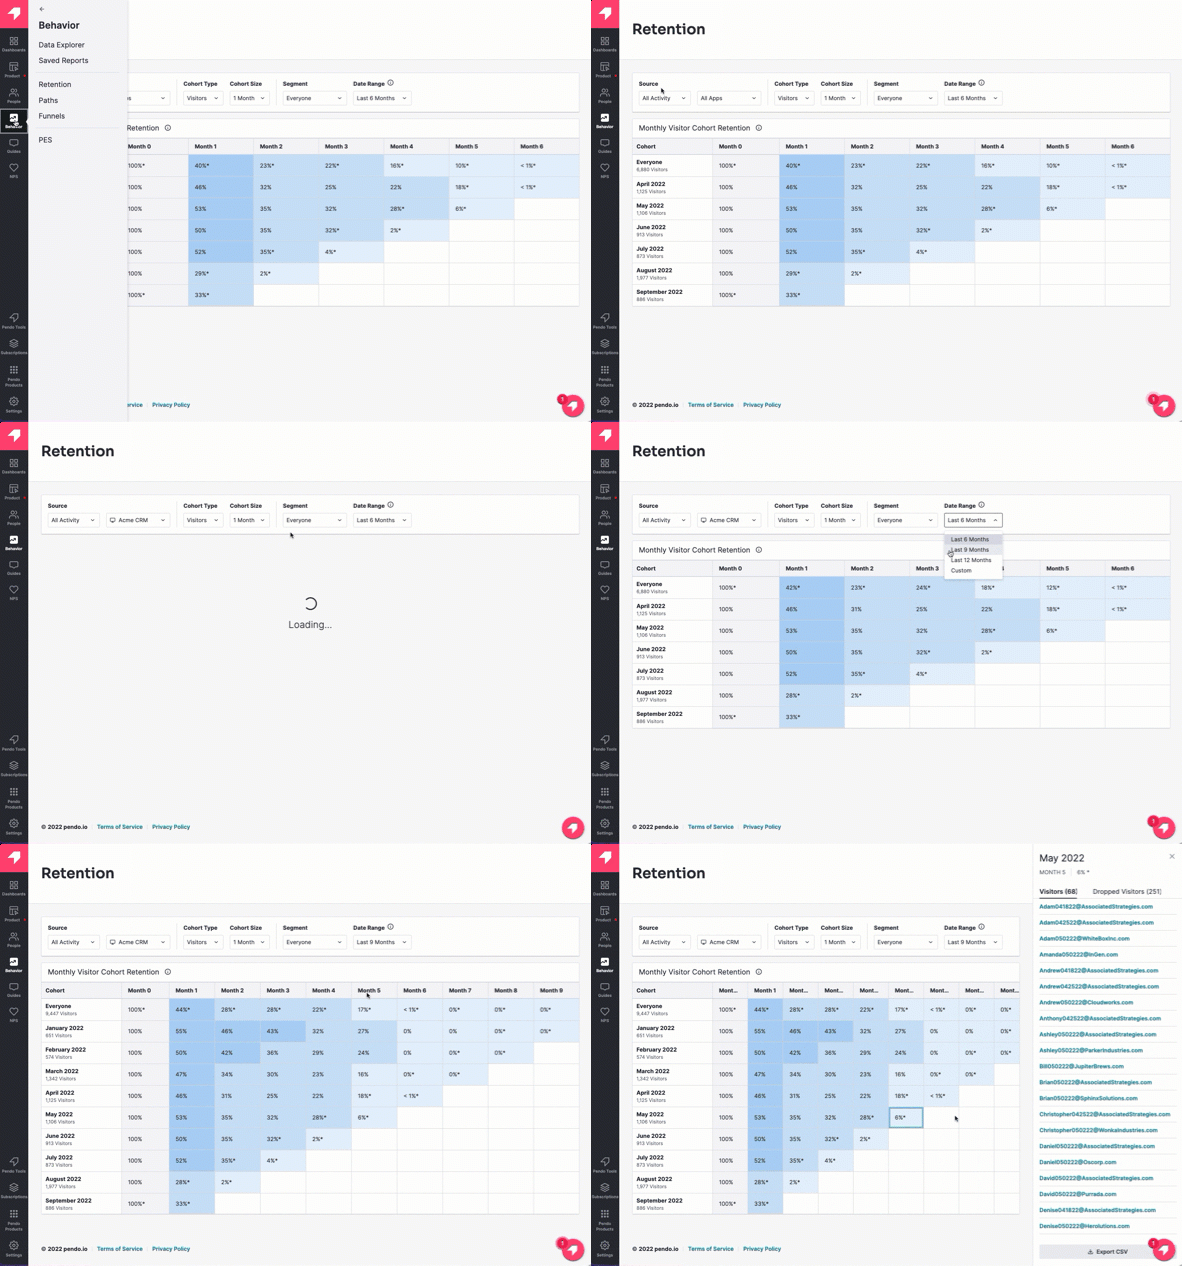
User retention looks at first time users within a specific timeframe (typically one month or one week) and calculates the percentage of those users that return in subsequent time periods. This helps you understand if customers are seeing value in your product—if they don’t keep logging in, they’re likely not finding your product valuable. You can also segment retention data to understand how it differs for various subsets of your user base, for example users with different job titles.
Interpreting retention for churn risk:
A single week of low engagement might not signal danger, but consistent retention decline over 2-3 cohorts is a strong churn indicator. Compare your retention curves against healthy accounts to quickly identify which cohorts need attention.
Pendoでは、いくつかの単純なステップでリテンションデータを簡単に表示できます。
- [行動(Behavior)]、[リテンション(Retention)]の順にクリックします
- ソースに[すべてのアクティビティ(All Activity)]を選択します
- アプリケーション、コホートのタイプとサイズ、セグメント、日付範囲など、残りの設定を選択します
- リテンションが下がり始めた場所のボックスをクリックすると、「離脱」した訪問者のリストが表示されます
If you see retention for a cohort decreased significantly (e.g. half as many visitors or accounts retained than the previous month), it’s time to start planning your intervention. If you’re able to steer these users back on track now, it can help prevent churn down the line. Download a CSV of the users in this cohort and use it to create a segment for these specific users. Then, use the segment to dig further into their in-app behavior: Are there certain workflows or steps where they’re getting stuck? Are they accessing your product’s key features? You can also use the segment to target these users with in-app walkthroughs and tutorials to ensure they’re getting the most out of your product.
3. 価値の高いフィーチャー(機能)の使用
Every product has features that are the most important—and critical to customers realizing value and continuing to use the application over time. For example, for a business expense reporting tool, one of these features is likely the “Create report” button.
Identifying your high-value features:
Look at accounts with the highest retention and analyze which features they use most frequently. These are typically your "power features"—the capabilities that, once adopted, dramatically increase stickiness and reduce churn risk.
One way to view this data in Pendo is by using an Account Report.
If users aren’t engaging with your product’s high-value features, it’s an indication they aren’t getting value, and could be an early indication of future churn. One way to view this data in Pendo is by using an Account Report. Here are some steps to get started:
- 左側のサイドバーで、[ピープル(People)]、[アカウント(Accounts)]の順に移動します
- [アカウントレポート(Account Reports)]タブをクリックし、[レポートの作成(Create Report)]ボタンをクリックします
- レポートを作成し、適切なセグメントを選択します(例:企業アカウントのデータのみを確認したい場合)
- 価値の高い機能の使用、ガイド閲覧数、投票調査の回答数など、レポートに列を追加します
- レポートを使用して、どのアカウントがコア機能にアクセスしているか、それらが関連するアプリ内ガイドや投票調査に参加しているかを確認します
ユーザーが特定の重要な機能を使用していないことがわかった場合は、その行動の背後にある「理由」を把握するために、検討を開始します。— これらの機能をユーザージャーニーの早い段階から紹介するようなオンボーディング体験はあるか? これらの機能は複雑であるため、追加のアプリ内コンテキストと教育が必要ではないか?— 特に新規ユーザーの場合は、アプリ内体験を見直し、Pendoガイドを使用して、ユーザーがプロダクトで成功するために必要なツールや情報を確実に入手できるようにします。
Taking action on feature adoption gaps:
When you identify accounts with low adoption of high-value features, trigger targeted in-app guides that walk them through those specific capabilities. This combination of identifying risk through analytics and addressing it through in-app guidance creates a proactive loop that keeps customers engaged.
Combining These Signals for Accurate Churn Prediction
Product Engagement Score, retention, and feature usage are most powerful when analyzed together. An account with declining PES and dropping retention is at significantly higher risk than one showing just a single warning sign. By monitoring all three metrics, you can identify at-risk customers early and intervene with targeted guidance before churn becomes inevitable.
As your customer base grows, consider how you can automate this analysis across all accounts. What's manageable for 50 customers becomes impossible at 500 or 5,000. Tools that combine product usage data with AI-powered pattern recognition can help scale these insights while ensuring no at-risk customer goes unnoticed.
Ready to take the next step?
Pendo Predict uses AI to automatically analyze these signals across your entire customer base, identifying churn risk and expansion opportunities without requiring a data science team.


![[object Object]](https://cdn.builder.io/api/v1/image/assets%2F6a96e08774184353b3aa88032e406411%2F39f3ccde352b460cbf348ccc952054cd?format=webp)


